| The SHEWHART Procedure |
Example 13.43 Analyzing Nonnormal Process Data
[See SHWXS4 in the SAS/QC Sample Library]The standard control limits for  charts (see Table 13.77) are calculated under the assumption that the data are normally distributed. This example illustrates how a transformation to normality can be used in conjunction with
  and charts.
The length of a metal brace is measured in centimeters for each of 20 braces sampled daily. Subgroup samples are collected for nineteen days, and the data are analyzed to determine if the manufacturing process is in statistical control.
data Lengthdata;
   informat Day date7.;
   format Day date5.;
   label Length='Brace Length in cm';
   input Day @;
   do i=1 to 5;
      input Length @;
      output;
      end;
   drop i;
   datalines;
02JAN86  113.64  119.60  111.66  111.88  125.29
02JAN86  114.08  115.28  127.84  109.97  109.34
02JAN86  109.65  121.76  112.17  116.01  111.64
02JAN86  112.70  114.43  110.27  114.76  125.89
03JAN86  115.92  113.62  117.52  114.44  118.08
03JAN86  111.13  118.42  112.16  112.25  107.71

   ... more lines ...

20JAN86  112.84  109.01  110.03  114.44  115.21
20JAN86  115.15  112.34  114.99  109.70  111.20
20JAN86  117.81  119.51  109.03  111.61  118.01
20JAN86  113.55  114.78  112.91  111.87  118.54
;
run;
The following statements create preliminary and charts for the lengths:
ods graphics on;
title 'Mean and Standard Deviation Charts for Brace Length';
proc shewhart data=Lengthdata;
   xschart Length*Day / odstitle = title;
run;
The charts are shown in Output 13.43.1.
and Charts
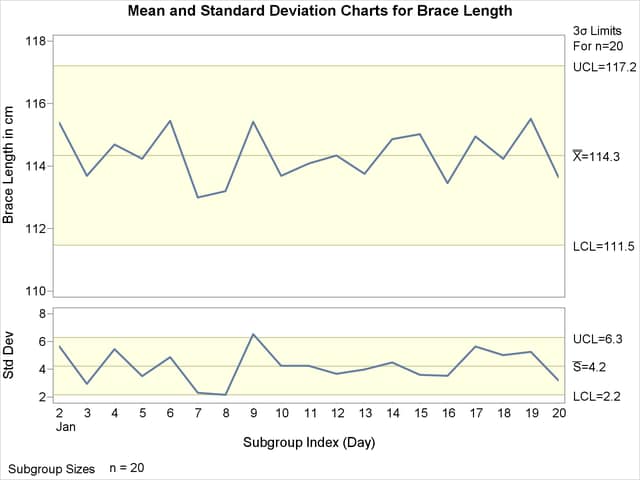
The chart suggests that the process is not in control, since the standard deviation of the measurements recorded on January 9 exceeds its upper control limit. In addition, a number of other points on the chart are close to the control limits.
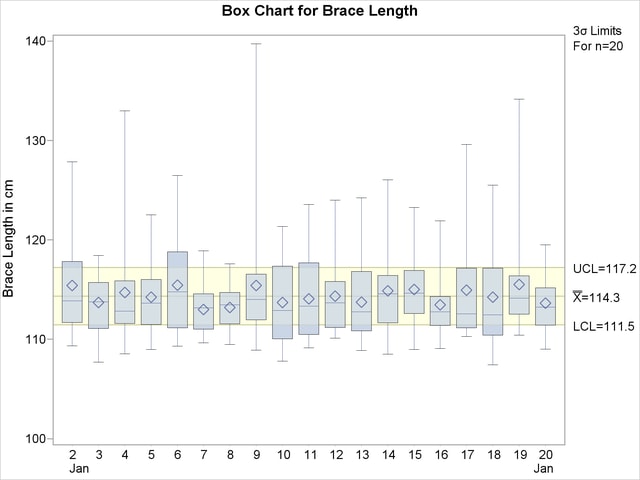
The following statements create a box chart for the lengths (for more information about box charts, see BOXCHART Statement).
title 'Box Chart for Brace Length';
proc shewhart data=Lengthdata;
   boxchart Length*Day / serifs
                         ranges
                         nohlabel
                         nolegend
                         odstitle = title;
run;
The chart, shown in Output 13.43.2, reveals that most of the subgroup distributions are skewed to the right. Consequently, the chart shown in Output 13.43.1 should be interpreted with caution, since control limits for charts are based on the assumption that the data are normally distributed.
No special cause for the skewness of the subgroup distributions is discovered. This indicates that the process is in statistical control and that the length distribution is naturally skewed.
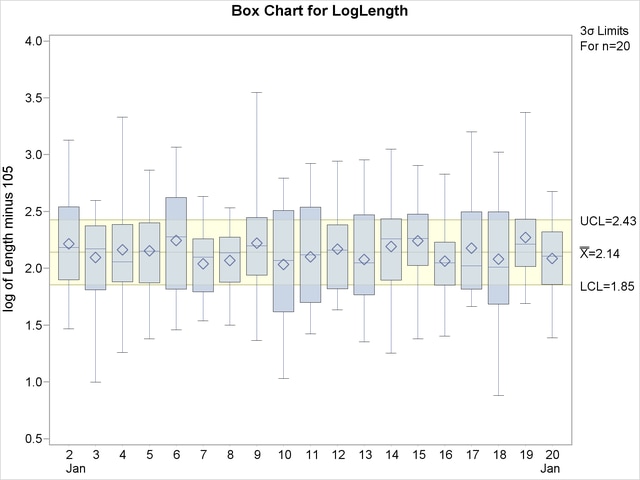
The following statements apply a lognormal transformation to the length measurements and display a box chart for the transformed data:
data Lengthdata;
   set Lengthdata;
   LogLength=log(Length-105);
label LogLength='log of Length minus 105';
run;
title 'Box Chart for log(Length-105)';
proc shewhart data=Lengthdata;
   boxchart LogLength*Day / serifs
                            ranges
                            nohlabel
                            nolegend;
run;
The chart, shown in Output 13.43.3, indicates that the subgroup distributions of LogLength are approximately normal (this can be verified with goodness-of-fit tests by using the CAPABILITY procedure).
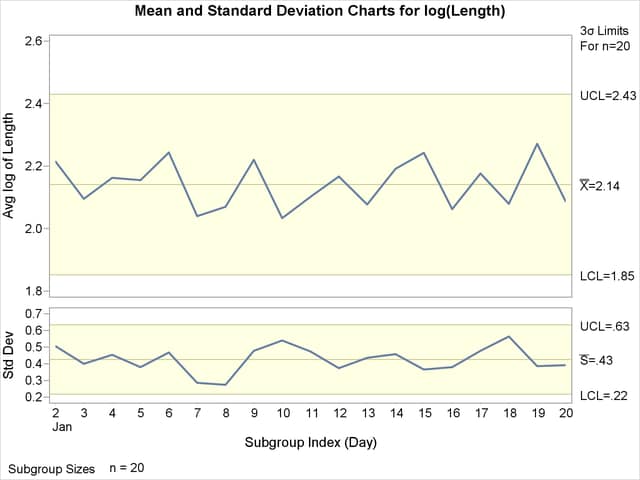
Finally, and charts, shown in Output 13.43.4, are created for LogLength. They indicate that the variability and mean level of the transformed lengths are in control.
title 'Mean and Standard Deviation Charts for log(Length)';
proc shewhart data=Lengthdata;
   xschart LogLength*Day / split    = '/'
                           odstitle = title;
   label LogLength='Avg log of Length/Std Dev';
run;
ods graphics off;
and Charts for Transformed Length
Copyright © SAS Institute, Inc. All Rights Reserved.