| The SHEWHART Procedure |
Example 13.41 Specifying Probability Limits
[See SHWXS2 in the SAS/QC Sample Library]This example illustrates how to create  and
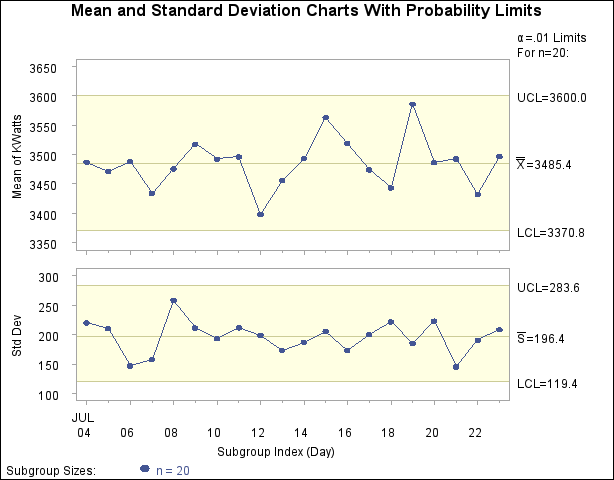
and  charts with probability limits. The following statements read the kilowatt power output measurements from the data set Turbine (see Creating Charts for Means and Standard Deviations from Raw Data) and create the and charts shown in Output 13.41.1:
symbol v=dot h=.8;
title 'Mean and Standard Deviation Charts With Probability Limits';
proc shewhart data=Turbine;
   xschart KWatts*Day  / alpha     = 0.01
                         outlimits = Oillim;
run;
The ALPHA= option specifies the probability ( ) that a subgroup summary statistic is outside the limits. Here, the limits are computed so that the probability that a subgroup mean or standard deviation is less than its lower limit is
  , and the probability that a subgroup mean or standard deviation is greater than its upper limit is . This assumes that the measurements are normally distributed.
The OUTLIMITS= option names an output data set (Oillim) that saves the probability limits. The data set Oillim is shown in Output 13.41.2.
and Charts
The variable _ALPHA_ saves the value of . The value of the variable _SIGMAS_ is computed as  , where
  is the inverse standard normal distribution function. Note that, in this case, the probability limits for the mean are equivalent to
  limits.
Since all the points fall within the probability limits, it can be concluded that the process is in statistical control.
Copyright © SAS Institute, Inc. All Rights Reserved.