| The SHEWHART Procedure |
Example 13.17 Specifying Axis Labels
[See SHWMR3 in the SAS/QC Sample Library]This example illustrates various methods for specifying axis labels and other axis features for median and range charts. For further details, see Labeling Axes.
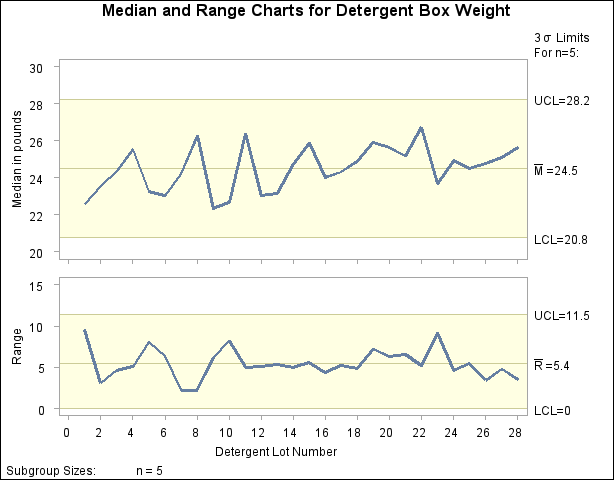
The charts in Figure 13.15.4, which are based on the data set Detergent introduced in the section Getting Started, display default labels for the horizontal and vertical axes. You can specify axis labels by associating labels with the process and subgroup variables as illustrated by the following statements:
title 'Median and Range Charts for Detergent Box Weight';
proc shewhart data=Detergent;
   mrchart Weight*Lot / split   = '/';
   label Lot    = 'Detergent Lot Number'
         Weight = 'Median in pounds/Range';
run;
The charts are shown in Output 13.17.1. The horizontal axis label is the label associated with the subgroup-variable Lot. The vertical axis label for the median chart, referred to as the primary vertical axis label, is the first portion of the label associated with the process variable Weight, up to but not including the split character, which is specified with the SPLIT= option. The vertical axis label for the range chart, referred to as the secondary vertical axis label, is the second portion of the label associated with Weight.
When the input data set is a HISTORY= data set, the vertical axis labels are determined by the label associated with the subgroup median variable. This is illustrated by the following statements, which use the data set DETSUM introduced in Creating Charts for Medians and Ranges from Summary Data:
title 'Median and Range Charts for Detergent Box Weight';
proc shewhart history=Detsum;
   mrchart Weight*Lot / split = '/';
   label Lot     = 'Detergent Lot Number'
         WeightM = 'Median (pounds)/Range';
run;
The charts are identical to those in Output 13.17.1.
When the input data set is a TABLE= data set, the vertical axis labels are determined by the label associated with the subgroup median variable _SUBMED_. This is illustrated by the following statements, which use the data set Dtable introduced in Figure 13.15.9:
title 'Median and Range Charts for Detergent Box Weight';
proc shewhart table=Dtable;
   mrchart Weight*Lot / split = '/';
   label Lot      = 'Detergent Lot Number'
         _submed_ = 'Median (pounds)/Range';
run;
The charts are identical to those in Output 13.17.1.
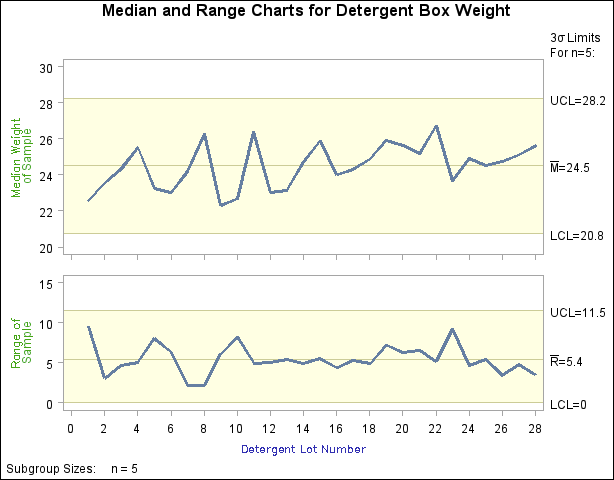
When you are creating traditional graphics, you can use AXIS statements to enhance the appearance of the axes. This method is illustrated by the following statements:
title 'Median and Range Charts for Detergent Box Weight';
proc shewhart data=Detergent;
   mrchart Weight*Lot / haxis   = axis1
                        vaxis   = axis2
                        vaxis2  = axis3;
axis1 label=(c=bib  f=simplex 'Detergent Lot Number'          );
axis2 label=(c=vilg f=simplex 'Median Weight' j=c 'of Sample' );
axis3 label=(c=vilg f=simplex 'Range of'      j=c 'Sample'    );
run;
The charts are shown in Output 13.17.2.
You can use AXIS statements to customize a variety of axis features. For details, see SAS/GRAPH: Reference.
Copyright © SAS Institute, Inc. All Rights Reserved.