| The SHEWHART Procedure |
Creating Charts for Medians from Raw Data
[See SHWMCHR in the SAS/QC Sample Library]A consumer products company weighs detergent boxes (in pounds) to determine whether the fill process is in control. The following statements create a SAS data set named Detergent, which contains the weights for five boxes in each of 28 lots. A lot is considered a rational subgroup.
data Detergent;
   input Lot @;
   do i=1 to 5;
      input Weight @;
      output;
   end;
drop i;
datalines;
 1 17.39 26.93 19.34 22.56 24.49
 2 23.63 23.57 23.54 20.56 22.17
 3 24.35 24.58 23.79 26.20 21.55
 4 25.52 28.02 28.44 25.07 23.39
 5 23.25 21.76 29.80 23.09 23.70
 6 23.01 22.67 24.70 20.02 26.35
 7 23.86 24.19 24.61 26.05 24.18
 8 26.00 26.82 28.03 26.27 25.85
 9 21.58 22.31 25.03 20.86 26.94
10 22.64 21.05 22.66 29.26 25.02
11 26.38 27.50 23.91 26.80 22.53
12 23.01 23.71 25.26 20.21 22.38
13 23.15 23.53 22.98 21.62 26.99
14 26.83 23.14 24.73 24.57 28.09
15 26.15 26.13 20.57 25.86 24.70
16 25.81 23.22 23.99 23.91 27.57
17 25.53 22.87 25.22 24.30 20.29
18 24.88 24.15 25.29 29.02 24.46
19 22.32 25.96 29.54 25.92 23.44
20 25.63 26.83 20.95 24.80 27.25
21 21.68 21.11 26.07 25.17 27.63
22 26.72 27.05 24.90 30.08 25.22
23 31.58 22.41 23.67 23.47 24.90
24 28.06 23.44 24.92 24.64 27.42
25 21.10 22.34 24.96 26.50 24.51
26 23.80 24.03 24.75 24.82 27.21
27 25.10 26.09 27.21 24.28 22.45
28 25.53 22.79 26.26 25.85 25.64
;
run;
A partial listing of Detergent is shown in Figure 13.13.3.
The data set Detergent is said to be in "strung-out" form, since each observation contains the lot number and weight of a single box. The first five observations contain the weights for the first lot, the second five observations contain the weights for the second lot, and so on. Because the variable Lot classifies the observations into rational subgroups, it is referred to as the subgroup-variable. The variable Weight contains the weights and is referred to as the process variable (or process for short).
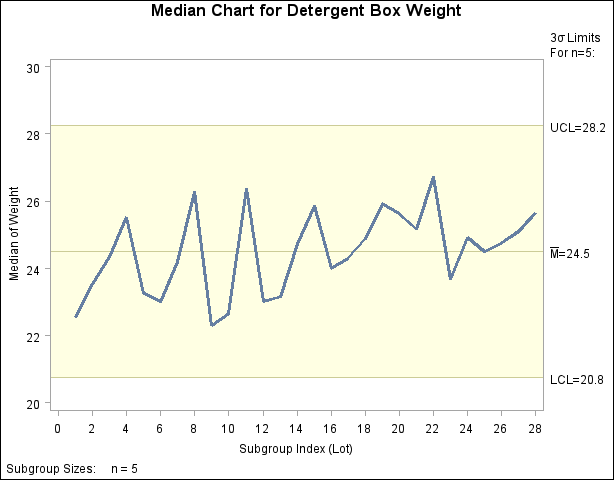
The within-subgroup variability of the weights is known to be stable. You can use a median chart to determine whether the mean level of the weights is in control. The following statements create the median chart shown in Figure 13.13.4:
title 'Median Chart for Detergent Box Weight';
proc shewhart data=Detergent;
   mchart Weight*Lot;
run;
This example illustrates the basic form of the MCHART statement. After the keyword MCHART, you specify the process to analyze (in this case, Weight) followed by an asterisk and the subgroup-variable (Lot).
The input data set is specified with the DATA= option in the PROC SHEWHART statement.

Each point on the chart represents the median of the weights for a particular lot. For instance, the weights for the first lot are 17.39, 19.34, 22.56, 24.49, and 26.93, and consequently, the median plotted for this lot is  .
.
Since all of the subgroup medians lie within the control limits, you can conclude that the process is in statistical control. By default, the control limits shown are  limits estimated from the data; the formulas for the limits are given in Table 13.26. You can also read control limits from an input data set; see Reading Preestablished Control Limits.
For computational details, see Constructing Median Charts. For more details on reading raw measurements, see DATA= Data Set.
Copyright © SAS Institute, Inc. All Rights Reserved.