| The SHEWHART Procedure |
Creating c Charts from Nonconformities per Unit
[See SHWCCHR1 in the SAS/QC Sample Library]In the previous example, the input data set provided the number of nonconformities per subgroup sample. However, in some applications, as illustrated here, the data may be provided as the number of nonconformities per inspection unit for each subgroup.
A clothing manufacturer ships shirts in boxes of ten. Prior to shipment, each shirt is inspected for flaws. Since the manufacturer is interested in the average number of flaws per shirt, the number of flaws found in each box is divided by ten and then recorded. The following statements create a SAS data set named Shirts, which contains the average number of flaws per shirt for 25 boxes:
data Shirts;
   input Box avgdefu @@;
   avgdefn=10;
   datalines;
 1  0.4   2  0.7   3  0.5   4  1.0   5  0.3
 6  0.2   7  0.0   8  0.4   9  0.4  10  0.6
11  0.2  12  0.7  13  0.3  14  0.1  15  0.3
16  0.6  17  0.6  18  0.3  19  0.7  20  0.3
21  0.0  22  0.1  23  0.5  24  0.6  25  0.4
;
run;
A partial listing of Shirts is shown in Figure 13.7.9.
The data set Shirts contains three variables: the box number (Box), the average number of flaws per shirt (avgdefu), and the number of shirts per box (avgdefn). Here, a subgroup is a box of shirts, and an inspection unit is an individual shirt. Note that each subgroup consists of ten inspection units.
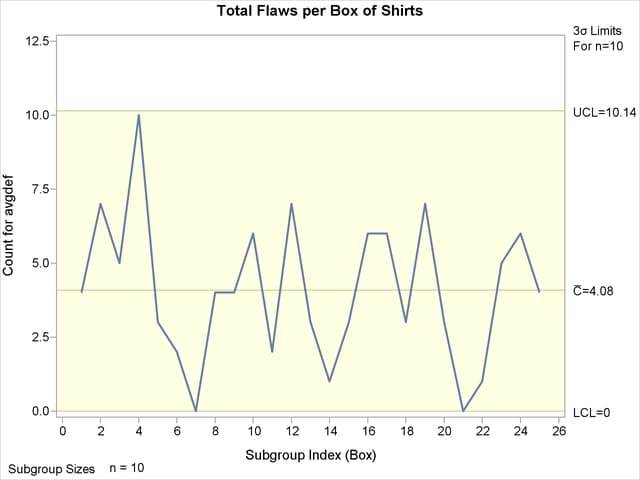
To create a  chart plotting the total number of flaws per box (instead of per shirt), you can specify Shirts as a HISTORY= data set.
ods graphics on;
title 'Total Flaws per Box of Shirts';
proc shewhart history=Shirts;
   cchart avgdef*Box / odstitle=title;
run;
ods graphics off;
The ODS GRAPHICS ON statement specified before the PROC SHEWHART statement enables ODS Graphics, so the chart is created using ODS Graphics instead of traditional graphics.
Note that avgdef is not the name of a SAS variable in the data set but is instead the common prefix for the SAS variable names avgdefu and avgdefn. The suffix characters U and N indicate number of nonconformities per unit and sample size, respectively. This naming convention enables you to specify two variables in the HISTORY= data set with a single name referred to as the process. The name Box specified after the asterisk is the name of the subgroup-variable. The chart is shown in Figure 13.7.10.
Chart for Boxes of Shirts (ODS Graphics)
In general, a HISTORY= input data set used with the CCHART statement must contain the following variables:
subgroup variable
subgroup number of nonconformities per unit variable
subgroup sample size variable
Furthermore, the names of the nonconformities per unit and sample size variables must begin with the process name specified in the CCHART statement and end with the special suffix characters U and N, respectively. If the names do not follow this convention, you can use the RENAME option to rename the variables for the duration of the SHEWHART procedure step. Suppose that, instead of the variables avgdefu and avgdefn, the data set Shirts contained the variables Shirtdef and Sizes. The following statements would temporarily rename Shirtdef and Sizes to avgdefu and avgdefn:
proc shewhart
   history=Shirts (rename=(Shirtdef = AvgdefU
                           Sizes    = AvgdefN ));
   cchart Avgdef*Box;
run;
For more information, see HISTORY= Data Set.
Copyright © SAS Institute, Inc. All Rights Reserved.