| The RELIABILITY Procedure |
| Comparison of Two Samples of Repair Data |
Nelson (2002) and Doganaksoy and Nelson (1998) show how the difference of MCFs from two samples can be used to compare the populations from which they are drawn. The RELIABILITY procedure provides Doganaksoy and Nelson’s confidence intervals for the pointwise difference of the two MCFs, which can be used to assess whether the difference is statistically significant.
Doganaksoy and Nelson (1998) give an example of two samples of locomotives with braking grids from two different production batches. Figure 12.35 contains a listing of the data. The variable ID is a unique identifier for individual locomotives. The variable Days provides the locomotive age in days. The variable Value is 1 if the age corresponds to a valve seat replacement or -1 if the age corresponds to the locomotive’s latest age (the current end of its history). The variable Sample is a group variable that identifies the grid production batch.
   data grids;
      if _N_ < 40 then sample = 'Sample1';
      else sample = 'Sample2';
      input ID$ days value @@;
      datalines;
   S1-01 462  1    S1-01 730 -1    S1-02 364  1    S1-02 391  1
   S1-02 548  1    S1-02 724 -1    S1-03 302  1    S1-03 444  1
   S1-03 500  1    S1-03 730 -1    S1-04 250  1    S1-04 730 -1
   S1-05 500  1    S1-05 724 -1    S1-06  88  1    S1-06 724 -1
   S1-07 272  1    S1-07 421  1    S1-07 552  1    S1-07 625  1
   S1-07 719 -1    S1-08 481  1    S1-08 710 -1    S1-09 431  1
   S1-09 710 -1    S1-10 367  1    S1-10 710 -1    S1-11 635  1
   S1-11 650  1    S1-11 708 -1    S1-12 402  1    S1-12 700 -1
   S1-13  33  1    S1-13 687 -1    S1-14 287  1    S1-14 687 -1
   S1-15 317  1    S1-15 498  1    S1-15 657 -1    S2-01 203  1
   S2-01 211  1    S2-01 277  1    S2-01 373  1    S2-01 511 -1
   S2-02 293  1    S2-02 503 -1    S2-03 173  1    S2-03 470 -1
   S2-04 242  1    S2-04 464 -1    S2-05  39  1    S2-05 464 -1
   S2-06  91  1    S2-06 462 -1    S2-07 119  1    S2-07 148  1
   S2-07 306  1    S2-07 461 -1    S2-08 382  1    S2-08 460 -1
   S2-09 250  1    S2-09 434 -1    S2-10 192  1    S2-10 448 -1
   S2-11 369  1    S2-11 448 -1    S2-12  22  1    S2-12 447 -1
   S2-13  54  1    S2-13 441 -1    S2-14 194  1    S2-14 432 -1
   S2-15  61  1    S2-15 419 -1    S2-16  19  1    S2-16 185  1
   S2-16 419 -1    S2-17 187  1    S2-17 416 -1    S2-18  93  1
   S2-18 205  1    S2-18 264  1    S2-18 415 -1
   ;
| Obs | sample | ID | days | value |
|---|---|---|---|---|
| 1 | Sample1 | S1-01 | 462 | 1 |
| 2 | Sample1 | S1-01 | 730 | -1 |
| 3 | Sample1 | S1-02 | 364 | 1 |
| 4 | Sample1 | S1-02 | 391 | 1 |
| 5 | Sample1 | S1-02 | 548 | 1 |
| 6 | Sample1 | S1-02 | 724 | -1 |
| 7 | Sample1 | S1-03 | 302 | 1 |
| 8 | Sample1 | S1-03 | 444 | 1 |
| 9 | Sample1 | S1-03 | 500 | 1 |
| 10 | Sample1 | S1-03 | 730 | -1 |
| 11 | Sample1 | S1-04 | 250 | 1 |
| 12 | Sample1 | S1-04 | 730 | -1 |
| 13 | Sample1 | S1-05 | 500 | 1 |
| 14 | Sample1 | S1-05 | 724 | -1 |
| 15 | Sample1 | S1-06 | 88 | 1 |
| 16 | Sample1 | S1-06 | 724 | -1 |
| 17 | Sample1 | S1-07 | 272 | 1 |
| 18 | Sample1 | S1-07 | 421 | 1 |
| 19 | Sample1 | S1-07 | 552 | 1 |
| 20 | Sample1 | S1-07 | 625 | 1 |
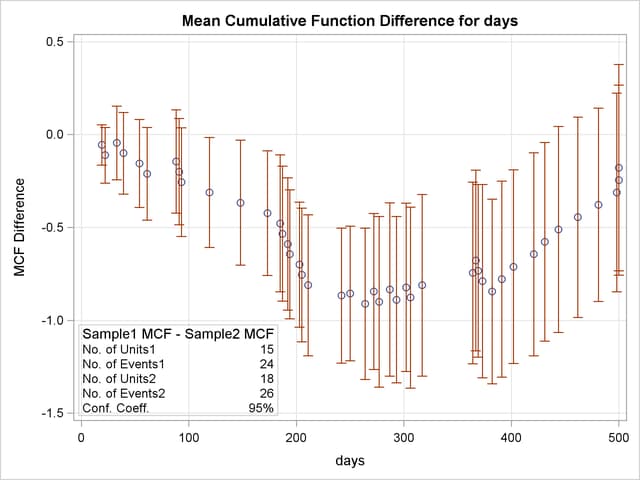
The following statements request the Nelson (1995) nonparametric estimate and confidence limits for the difference of the MCF functions shown in Figure 12.36 for the braking grids:
proc reliability data=grids;
   unitid ID;
   mcfplot days*value(-1) = sample / mcfdiff;
run;
The MCFPLOT statement requests a plot of each MCF estimate as a function of age (provided by Days), and it specifies that the end of history for each system is identified by Value equal to -1. The variable Sample identifies the two samples of braking grids. The option MCFDIFF requests that the difference between the MCFs of the two groups given in the variable Sample be computed and plotted. Confidence limits for the MCF difference are also computed and plotted. The UNITID statement specifies that the variable Id uniquely identify each system.
Figure 12.36 shows the plot of the MCF difference function and pointwise 95% confidence intervals. Since the pointwise confidence limits do not include zero for some system ages, the difference between the two populations is statistically significant.
A listing of the tabular output is shown in Figure 12.37. It contains a summary of the repair data for the two samples, estimates, standard errors, and confidence intervals for the MCF difference.
| MCF Difference Data Summary | |
|---|---|
| Input Data Set | WORK.GRIDS |
| Group 1 | Sample1 |
| Observations Used | 39 |
| Number of Units | 15 |
| Number of Events | 24 |
| Group 2 | Sample2 |
| Observations Used | 44 |
| Number of Units | 18 |
| Number of Events | 26 |
| Sample MCF Differences | |||||
|---|---|---|---|---|---|
| Age | MCF Difference | Standard Error | 95% Confidence Limits | Unit ID | |
| Lower | Upper | ||||
| 19.00 | -0.056 | 0.056 | -0.164 | 0.053 | S2-16 |
| 22.00 | -0.111 | 0.076 | -0.261 | 0.038 | S2-12 |
| 33.00 | -0.044 | 0.101 | -0.243 | 0.154 | S1-13 |
| 39.00 | -0.100 | 0.112 | -0.320 | 0.120 | S2-05 |
| 54.00 | -0.156 | 0.121 | -0.392 | 0.081 | S2-13 |
| 61.00 | -0.211 | 0.127 | -0.461 | 0.039 | S2-15 |
| 88.00 | -0.144 | 0.142 | -0.422 | 0.133 | S1-06 |
| 91.00 | -0.200 | 0.146 | -0.486 | 0.086 | S2-06 |
| 93.00 | -0.256 | 0.149 | -0.548 | 0.037 | S2-18 |
| 119.00 | -0.311 | 0.151 | -0.607 | -0.015 | S2-07 |
| 148.00 | -0.367 | 0.172 | -0.703 | -0.030 | S2-07 |
| 173.00 | -0.422 | 0.171 | -0.758 | -0.087 | S2-03 |
| 185.00 | -0.478 | 0.188 | -0.846 | -0.110 | S2-16 |
| 187.00 | -0.533 | 0.185 | -0.897 | -0.170 | S2-17 |
| 192.00 | -0.589 | 0.182 | -0.946 | -0.232 | S2-10 |
| 194.00 | -0.644 | 0.177 | -0.992 | -0.297 | S2-14 |
| 203.00 | -0.700 | 0.172 | -1.037 | -0.363 | S2-01 |
| 205.00 | -0.756 | 0.183 | -1.115 | -0.396 | S2-18 |
| 211.00 | -0.811 | 0.194 | -1.191 | -0.432 | S2-01 |
| 242.00 | -0.867 | 0.185 | -1.230 | -0.503 | S2-04 |
| 250.00 | -0.856 | 0.185 | -1.218 | -0.494 | S1-04,S2-09 |
| 264.00 | -0.911 | 0.208 | -1.319 | -0.503 | S2-18 |
| 272.00 | -0.844 | 0.214 | -1.264 | -0.424 | S1-07 |
| 277.00 | -0.900 | 0.234 | -1.359 | -0.441 | S2-01 |
| 287.00 | -0.833 | 0.238 | -1.300 | -0.367 | S1-14 |
| 293.00 | -0.889 | 0.228 | -1.337 | -0.441 | S2-02 |
| 302.00 | -0.822 | 0.231 | -1.275 | -0.369 | S1-03 |
| 306.00 | -0.878 | 0.248 | -1.364 | -0.391 | S2-07 |
| 317.00 | -0.811 | 0.250 | -1.300 | -0.322 | S1-15 |
| 364.00 | -0.744 | 0.250 | -1.233 | -0.255 | S1-02 |
| 367.00 | -0.678 | 0.248 | -1.164 | -0.191 | S1-10 |
| 369.00 | -0.733 | 0.237 | -1.199 | -0.268 | S2-11 |
| 373.00 | -0.789 | 0.265 | -1.309 | -0.269 | S2-01 |
| 382.00 | -0.844 | 0.254 | -1.342 | -0.347 | S2-08 |
| 391.00 | -0.778 | 0.269 | -1.306 | -0.250 | S1-02 |
| 402.00 | -0.711 | 0.266 | -1.232 | -0.190 | S1-12 |
| 421.00 | -0.644 | 0.279 | -1.191 | -0.098 | S1-07 |
| 431.00 | -0.578 | 0.273 | -1.113 | -0.043 | S1-09 |
| 444.00 | -0.511 | 0.283 | -1.066 | 0.044 | S1-03 |
| 462.00 | -0.444 | 0.275 | -0.984 | 0.095 | S1-01 |
| 481.00 | -0.378 | 0.266 | -0.899 | 0.143 | S1-08 |
| 498.00 | -0.311 | 0.273 | -0.846 | 0.224 | S1-15 |
| 500.00 | -0.244 | 0.261 | -0.756 | 0.267 | S1-05 |
| 500.00 | -0.178 | 0.283 | -0.733 | 0.377 | S1-03 |
Copyright © SAS Institute, Inc. All Rights Reserved.