| The PARETO Procedure |
Displaying Summary Statistics on a Pareto Chart
[See PARETO7 in the SAS/QC Sample Library]During the manufacture of a metal-oxide semiconductor (MOS) capacitor, causes of failures were recorded before and after a tube in the diffusion furnace was cleaned. This information was saved in a SAS data set named Failure3.
data Failure3;
   length Cause $ 16 Stage $ 16 ;
   label  Cause = 'Cause of Failure' ;
   input  Stage & $ Cause & $ Counts;
datalines;
Before Cleaning   Contamination    14
Before Cleaning   Corrosion         2
Before Cleaning   Doping            1
Before Cleaning   Metallization     2
Before Cleaning   Miscellaneous     3
Before Cleaning   Oxide Defect      8
Before Cleaning   Silicon Defect    1
After Cleaning    Doping            0
After Cleaning    Corrosion         2
After Cleaning    Metallization     4
After Cleaning    Miscellaneous     2
After Cleaning    Oxide Defect      1
After Cleaning    Contamination    12
After Cleaning    Silicon Defect    2
;
run;
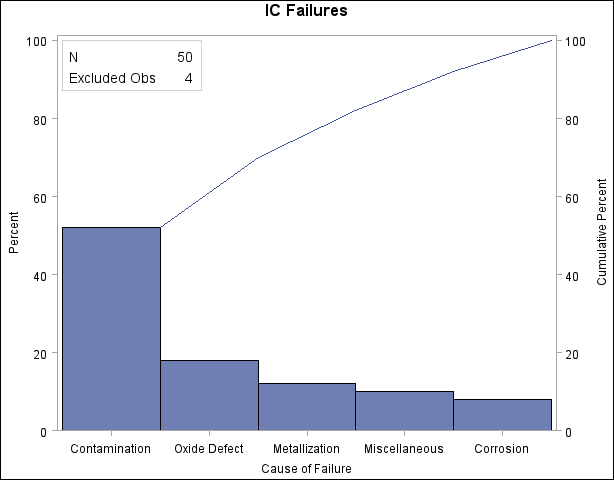
The following statements generate a Pareto chart from the Failure3 data. The MAXNCAT= option is specified to limit the number of Pareto categories to five. An INSET statement is used to display the total count for the categories displayed and the total count for the categories excluded by the MAXNCAT= option.
title 'IC Failures';
proc pareto data=Failure3;
   vbar Cause /
      freq     = Counts
      maxncat  = 5;
   inset n nexcl / height = 3;
run;
The resulting chart is displayed in Figure 11.12. The INSET statement immediately follows the chart statement that creates the graphical display (in this case, the VBAR statement). Specify the keywords for inset statistics (such as N and NEXCL) immediately after the word INSET. The inset statistics appear in the order in which you specify the keywords. The HEIGHT= option in the INSET statement specifies the text height used to display the statistics in the inset.
A complete list of keywords that you can use with the INSET statement is provided in Summary of INSET Keywords.

The following examples illustrate options commonly used for enhancing the appearance of an inset.
Copyright © SAS Institute, Inc. All Rights Reserved.