| The MACONTROL Procedure |
Creating Moving Average Charts from Raw Data
[See MACMA1 in the SAS/QC Sample Library]In the manufacture of a metal clip, the gap between the ends of the clip is a critical dimension. To monitor the process for a change in the average gap, subgroup samples of five clips are selected daily. The data are analyzed with a uniformly weighted moving average chart. The gaps recorded during the first twenty days are saved in a SAS data set named Clips1.
data Clips1;
   input Day @ ;
   do i=1 to 5;
      input Gap @ ;
      output;
      end;
   drop i;
   datalines;
 1  14.76  14.82  14.88  14.83  15.23
 2  14.95  14.91  15.09  14.99  15.13
 3  14.50  15.05  15.09  14.72  14.97
 4  14.91  14.87  15.46  15.01  14.99
 5  14.73  15.36  14.87  14.91  15.25
 6  15.09  15.19  15.07  15.30  14.98
 7  15.34  15.39  14.82  15.32  15.23
 8  14.80  14.94  15.15  14.69  14.93
 9  14.67  15.08  14.88  15.14  14.78
10  15.27  14.61  15.00  14.84  14.94
11  15.34  14.84  15.32  14.81  15.17
12  14.84  15.00  15.13  14.68  14.91
13  15.40  15.03  15.05  15.03  15.18
14  14.50  14.77  15.22  14.70  14.80
15  14.81  15.01  14.65  15.13  15.12
16  14.82  15.01  14.82  14.83  15.00
17  14.89  14.90  14.60  14.40  14.88
18  14.90  15.29  15.14  15.20  14.70
19  14.77  14.60  14.45  14.78  14.91
20  14.80  14.58  14.69  15.02  14.85
;
run;
The following statements produce the listing of the data set Clips1 shown in Figure 9.5.3:
title 'The Data Set CLIPS1';
proc print data=Clips1(obs=15) noobs;
run;
The data set Clips1 is said to be in "strung-out" form, since each observation contains the day and gap measurement of a single clip. The first five observations contain the gap measurements for the first day, the second five observations contain the gap measurements for the second day, and so on. Because the variable Day classifies the observations into rational subgroups, it is referred to as the subgroup-variable. The variable Gap contains the gap measurements and is referred to as the process variable (or process for short).
The within-subgroup variability of the gap measurements is known to be stable. You can use a uniformly weighted moving average chart to determine whether the mean level is in control. The following statements create the chart shown in Figure 9.5.4:
symbol h = .8;
title 'Moving Average Chart for Gap Measurements';
proc macontrol data=Clips1;
   machart Gap*Day / span=3;
run;
This example illustrates the basic form of the MACHART statement. After the keyword MACHART, you specify the process to analyze (in this case, Gap) followed by an asterisk and the subgroup-variable (Day). The SPAN= option specifies the number of terms to include in the moving average. Options such as SPAN= are specified after the slash (/) in the MACHART statement. A complete list of options is presented in the section Syntax. You must provide the span of the moving average. As an alternative to specifying the SPAN= option, you can read the span from an input data set; see Reading Preestablished Control Limit Parameters.
The input data set is specified with the DATA= option in the PROC MACONTROL statement.
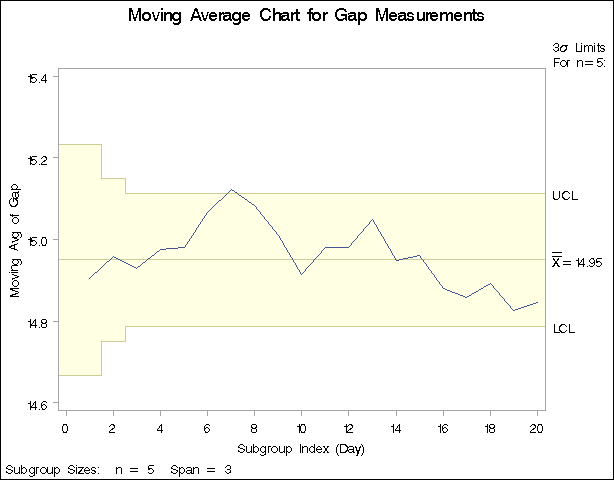
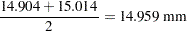
Each point on the chart represents the uniformly weighted moving average for a particular day. The moving average  plotted at Day=1 is simply the subgroup mean for Day=1. The moving average
  plotted at Day=2 is the average of the subgroup means for Day=1 and Day=2. The moving average
  plotted at Day=3 is the average of the subgroup means for Day=1, Day=2, and Day=3.
 |
 |
 |
|||
 |
|
 |
|||
 |
|
 |
For succeeding days, the moving average is similarly calculated as the average of the present and the two previous subgroup means (since a span of three is specified with the SPAN= option).
Note that the moving average for the seventh day lies above the upper control limit, signaling an out-of-control process.
By default, the control limits shown are  limits estimated from the data; the formulas for the limits are given in Table 9.9.
For computational details, see Constructing Uniformly Weighted Moving Average Charts. For more details on reading from a DATA= data set, see DATA= Data Set.
Copyright © SAS Institute, Inc. All Rights Reserved.