| The CUSUM Procedure |
Defining the V-Mask for a Two-Sided Cusum Scheme
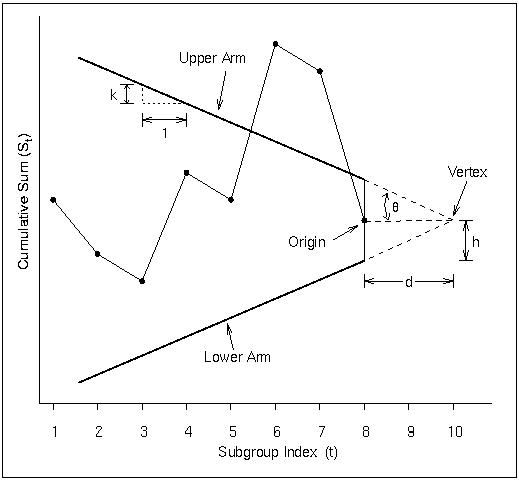
The dimensions of the V-mask can be specified using two distinct sets of two parameters.
 , defined as half of the angle formed by the V-mask arms, and
  , the distance between the origin and the vertex, as shown in Figure 6.14. This parameterization is used by many authors, including Johnson and Leone (1962, 1974) and Montgomery (1996).
  , the vertical distance between the origin and the upper (or lower) V-mask arm, and
  , the rise (drop) in the lower (upper) arm corresponding to an interval of one subgroup unit on the horizontal axis. You can specify the definition of an interval with the INTERVAL= option. This parameterization is used by Lucas (1976) and Wadsworth, Stephens, and Godfrey (1986). Lucas (1976) uses the symbols
  for and
  for , and Wadsworth, Stephens, and Godfrey (1986) use the symbol
  in place of .
The two parameterizations are related by the equations
 |
 |
where the aspect ratio  is the number of units on the vertical axis corresponding to one unit on the horizontal axis. The CUSUM procedure uses the and parameterization because it eliminates the need for working with aspect ratios. Furthermore, and are also useful for average run length computations and for parameterizing one-sided cusum schemes.
You can specify the V-mask in two ways:
geometrically, by providing
and (or simply ) with the H= and K= options or with the variables _H_ and _K_ in a LIMITS= data set in terms of error probabilities, by providing
 and
and  (or simply ) with the ALPHA= and BETA= options or with the variables _ALPHA_ and _BETA_ in a LIMITS= data set. The SIGMAS= option is an alternative to the ALPHA= option, and the variable _SIGMAS_ is an alternative to the variable _ALPHA_ (if the READSIGMAS option is specified).
If you provide and , and are computed using the formulas
 |
 |
If you provide but not , and are computed using the formulas
 |
 |
In the preceding equations, the error probability is divided by two because two-sided deviations from the target mean are detected. Refer to Johnson and Leone (1962, 1974).
Interpreting Two-Sided Cusum Charts
The origin of the V-mask is located at the most recently plotted point, as illustrated in Figure 6.14. As additional data are collected and the cumulative sum sequence is updated, the origin is relocated at the newest point. A shift or out-of-control condition is signaled at time  if one or more of the points plotted up to time cross an arm of the V-mask. An upward shift is signaled by points crossing the lower arm, and a downward shift is signaled by points crossing the upper arm. The time at which the shift occurred corresponds to the time at which a distinct change is observed in the slope of the plotted points.
Copyright © SAS Institute, Inc. All Rights Reserved.