| The ANOM Procedure |
Example 4.4 ANOM Charts with Unequal Group Sizes
[See ANMXEX1 in the SAS/QC Sample Library]Consider the example described in Creating ANOM Charts for Means from Response Values. Suppose that four of the 10 measurements were missing for the third and fourth labeler positions. The following statements create a SAS data set named LabelDev2, which contains the resulting deviation measurements:
data LabelDev2;
   input Position @;
   do i = 1 to 5;
      input Deviation @;
      output;
   end;
   drop i;
   datalines;
1  -0.0239  -0.0285  -0.0300  -0.0043  -0.0362
1  -0.0422  -0.0014  -0.0647   0.0094  -0.0016
2  -0.0201  -0.0273   0.0227  -0.0332   0.0366
2   0.0438   0.0556   0.0098   0.0564   0.0182
3  -0.0073   0.0285    .        .      -0.0139
3    .       0.0357   0.0235    .      -0.0020
4   0.0669   0.1073    .        .       0.0755
4    .       0.0561   0.0899    .       0.0530
5   0.0368   0.0036   0.0374   0.0116  -0.0074
5   0.0250  -0.0080   0.0302  -0.0015  -0.0464
6   0.0049  -0.0384  -0.0204  -0.0049  -0.0120
6   0.0071  -0.0308   0.0017  -0.0285  -0.0070
run;
The following statements create the ANOM chart shown in Output 4.4.1:
title 'Analysis of Label Deviations';
proc anom data=LabelDev2;
   xchart Deviation*Position;
   label Deviation = 'Mean Deviation from Center (mm)';
   label Position  = 'Labeler Position';
run;
Output 4.4.1
ANOM Chart with Unequal Group Sizes
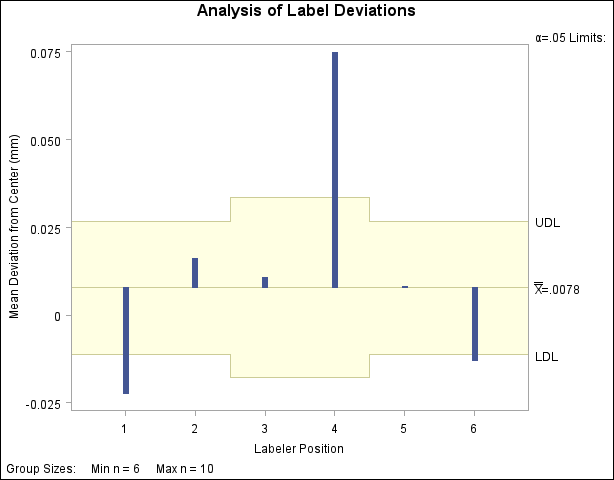
Note that the decision limits are automatically adjusted for the varying group sizes. The legend reports the minimum and maximum group sizes.
Copyright © SAS Institute, Inc. All Rights Reserved.