| The ANOM Procedure |
Creating ANOM Boxcharts from Group Summary Data
[See ANMBXGRP in the SAS/QC Sample Library]The previous example illustrates how you can create ANOM charts for means using measurement data. However, in many applications, the data are provided as group summary statistics. This example illustrates how you can use the BOXCHART statement with data of this type.
The following data set (Labels) provides the data from the preceding example in summarized form:
data Labels;
   input Position DeviationL Deviation1 DeviationX
         DeviationM Deviation3 DeviationH DeviationS;
   DeviationN = 10;
   datalines;
1  -0.0647  -0.0362  -0.02234  -0.02620  -0.0016  0.0094  0.02281
2  -0.0332  -0.0201   0.01625   0.02045   0.0438  0.0564  0.03347
3  -0.0440  -0.0139   0.00604   0.00570   0.0285  0.0486  0.02885
4   0.0362   0.0530   0.06473   0.06030   0.0755  0.1073  0.02150
5  -0.0464  -0.0074   0.00813   0.00760   0.0302  0.0374  0.02593
6  -0.0384  -0.0285  -0.01283  -0.00950   0.0017  0.0071  0.01599
run;
A listing of Labels is shown in Figure 4.4. There is exactly one observation for each group (note that the groups are still indexed by Position). There are eight summary variables in Labels.
DeviationL contains the group minimums (low values).
Deviation1 contains the
 th percentile (first quartile) of each group.
 DeviationX contains the group means.
DeviationM contains the group medians.
Deviation3 contains the
 th percentile (third quartile) of each group.
 DeviationH contains the group maximums (high values).
DeviationS contains the group standard deviations.
DeviationN contains the group sample sizes (these are all 10 in this case).
| The Data Set Labels |
| Position | DeviationL | Deviation1 | DeviationX | DeviationM | Deviation3 | DeviationH | DeviationS | DeviationN |
|---|---|---|---|---|---|---|---|---|
| 1 | -0.0647 | -0.0362 | -0.02234 | -0.02620 | -0.0016 | 0.0094 | 0.02281 | 10 |
| 2 | -0.0332 | -0.0201 | 0.01625 | 0.02045 | 0.0438 | 0.0564 | 0.03347 | 10 |
| 3 | -0.0440 | -0.0139 | 0.00604 | 0.00570 | 0.0285 | 0.0486 | 0.02885 | 10 |
| 4 | 0.0362 | 0.0530 | 0.06473 | 0.06030 | 0.0755 | 0.1073 | 0.02150 | 10 |
| 5 | -0.0464 | -0.0074 | 0.00813 | 0.00760 | 0.0302 | 0.0374 | 0.02593 | 10 |
| 6 | -0.0384 | -0.0285 | -0.01283 | -0.00950 | 0.0017 | 0.0071 | 0.01599 | 10 |
You can read this data set by specifying it as a SUMMARY= data set in the PROC ANOM statement, as follows:
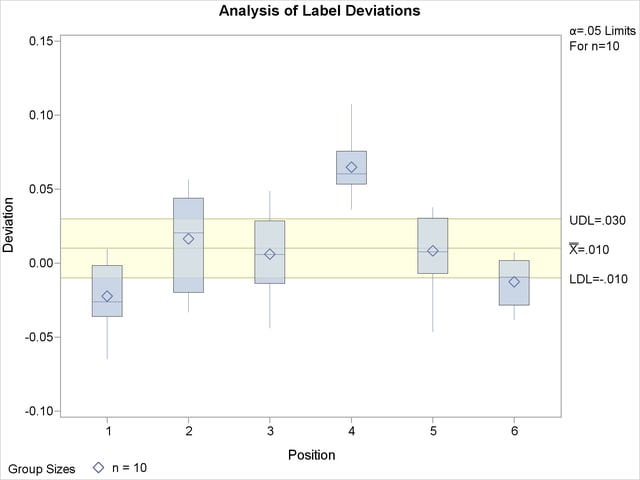
ods graphics on;
title 'Analysis of Label Deviations';
proc anom summary=Labels;
   boxchart Deviation*Position / odstitle=title1;
run;
ods graphics off;
The ODS GRAPHICS ON statement specified before the PROC ANOM statement enables ODS Graphics, so the boxchart is created by using ODS Graphics instead of traditional graphics. The resulting ANOM boxchart is shown in Figure 4.5.
Note that Deviation is not the name of a SAS variable in the data set but is, instead, the common prefix for the names of the eight summary variables. The suffix characters L, 1, X, M, 3, H, S, and N indicate the contents of the variable. For example, the suffix characters 1 and 3 indicate first and third quartiles. Thus, you can specify three group summary variables in a SUMMARY= data set with a single name (Deviation), which is referred to as the response. The name Position specified after the asterisk is the name of the group-variable.
In general, a SUMMARY= input data set used with the BOXCHART statement must contain the following variables:
group variable
group minimum variable
group first quartile variable
group mean variable
group median variable
group third quartile variable
group maximum variable
group standard deviation variable
group sample size variable
Furthermore, the names of the summary variables must begin with the response name specified in the BOXCHART statement and end with the appropriate suffix characters. If the names do not follow this convention, you can use the RENAME option in the PROC ANOM statement to rename the variables for the duration of the ANOM procedure step. If a label is associated with the group mean variable, it is used to label the vertical axis.
In summary, the interpretation of response depends on the input data set.
If raw data are read using the DATA= option (as in the previous example), response is the name of the SAS variable containing the response measurements.
If summary data are read using the SUMMARY= option (as in this example), response is the common prefix for the names of the variables containing the summary statistics.
For more information, see SUMMARY= Data Set.
Copyright © SAS Institute, Inc. All Rights Reserved.