| The CORR Procedure |
Example 2.2 Computing Correlations between Two Sets of Variables
The following statements create a data set which contains measurements for four iris parts from Fisher’s iris data (1936): sepal length, sepal width, petal length, and petal width. Each observation represents one specimen.
   *------------------- Data on Iris Setosa --------------------*
   | The data set contains 50 iris specimens from the species   |
   | Iris Setosa with the following four measurements:          |
   | SepalLength (sepal length)                                 |
   | SepalWidth  (sepal width)                                  |
   | PetalLength (petal length)                                 |
   | PetalWidth  (petal width)                                  |
   | Certain values were changed to missing for the analysis.   |
   *------------------------------------------------------------*;
   data Setosa;
     input SepalLength SepalWidth PetalLength PetalWidth @@;
     label sepallength='Sepal Length in mm.'
           sepalwidth='Sepal Width in mm.'
           petallength='Petal Length in mm.'
           petalwidth='Petal Width in mm.';
     datalines;
   50 33 14 02  46 34 14 03  46 36 .  02
   51 33 17 05  55 35 13 02  48 31 16 02
   52 34 14 02  49 36 14 01  44 32 13 02
   50 35 16 06  44 30 13 02  47 32 16 02
   48 30 14 03  51 38 16 02  48 34 19 02
   50 30 16 02  50 32 12 02  43 30 11 .
   58 40 12 02  51 38 19 04  49 30 14 02
   51 35 14 02  50 34 16 04  46 32 14 02
   57 44 15 04  50 36 14 02  54 34 15 04
   52 41 15 .   55 42 14 02  49 31 15 02
   54 39 17 04  50 34 15 02  44 29 14 02
   47 32 13 02  46 31 15 02  51 34 15 02
   50 35 13 03  49 31 15 01  54 37 15 02
   54 39 13 04  51 35 14 03  48 34 16 02
   48 30 14 01  45 23 13 03  57 38 17 03
   51 38 15 03  54 34 17 02  51 37 15 04
   52 35 15 02  53 37 15 02
   ;
The following statements request a correlation analysis between two sets of variables, the sepal measurements (length and width) and the petal measurements (length and width):
ods graphics on;
title 'Fisher (1936) Iris Setosa Data';
proc corr data=Setosa sscp cov plots;
   var  sepallength sepalwidth;
   with petallength petalwidth;
run;
ods graphics off;
The "Simple Statistics" table in Output 2.2.1 displays univariate statistics for variables in the VAR and WITH statements.
| 2 With Variables: | PetalLength PetalWidth |
|---|---|
| 2 Variables: | SepalLength SepalWidth |
| Simple Statistics | |||||||
|---|---|---|---|---|---|---|---|
| Variable | N | Mean | Std Dev | Sum | Minimum | Maximum | Label |
| PetalLength | 49 | 14.71429 | 1.62019 | 721.00000 | 11.00000 | 19.00000 | Petal Length in mm. |
| PetalWidth | 48 | 2.52083 | 1.03121 | 121.00000 | 1.00000 | 6.00000 | Petal Width in mm. |
| SepalLength | 50 | 50.06000 | 3.52490 | 2503 | 43.00000 | 58.00000 | Sepal Length in mm. |
| SepalWidth | 50 | 34.28000 | 3.79064 | 1714 | 23.00000 | 44.00000 | Sepal Width in mm. |
When the WITH statement is specified together with the VAR statement, the CORR procedure produces rectangular matrices for statistics such as covariances and correlations. The matrix rows correspond to the WITH variables (PetalLength and PetalWidth), while the matrix columns correspond to the VAR variables (SepalLength and SepalWidth). The CORR procedure uses the WITH variable labels to label the matrix rows.
The SSCP option requests a table of the uncorrected sum-of-squares and crossproducts matrix, and the COV option requests a table of the covariance matrix. The SSCP and COV options also produce a table of the Pearson correlations.
The sum-of-squares and crossproducts statistics for each pair of variables are computed by using observations with nonmissing row and column variable values. The "Sums of Squares and Crossproducts" table in Output 2.2.2 displays the crossproduct, sum of squares for the row variable, and sum of squares for the column variable for each pair of variables.
The variances are computed by using observations with nonmissing row and column variable values. The "Variances and Covariances" table in Output 2.2.3 displays the covariance, variance for the row variable, variance for the column variable, and associated degrees of freedom for each pair of variables.
| Variances and Covariances Covariance / Row Var Variance / Col Var Variance / DF |
||||||||||||
|---|---|---|---|---|---|---|---|---|---|---|---|---|
| SepalLength | SepalWidth | |||||||||||
|
|
|
||||||||||
|
|
|
||||||||||
When there are missing values in the analysis variables, the "Pearson Correlation Coefficients" table in Output 2.2.4 displays the correlation, the  -value under the null hypothesis of zero correlation, and the number of observations for each pair of variables. Only the correlation between PetalWidth and SepalLength and the correlation between PetalWidth and SepalWidth are slightly positive.
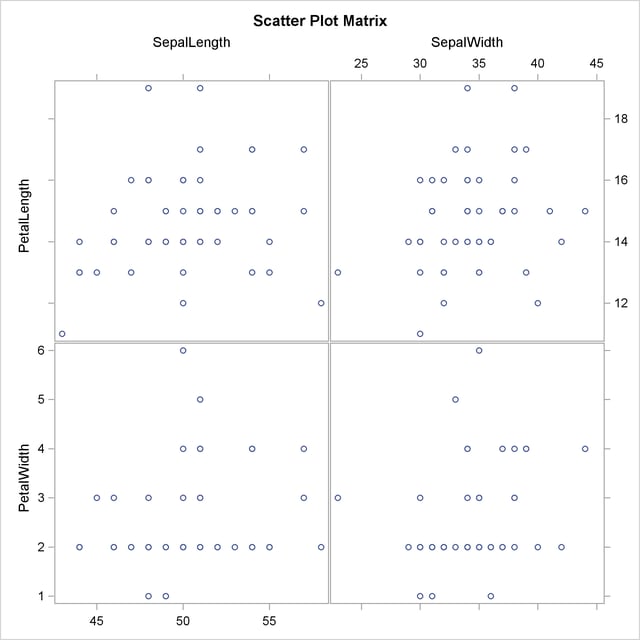
When you specify the ODS GRAPHICS ON statement, the PROC CORR displays a scatter matrix plot by default. Output 2.2.5 displays a rectangular scatter plot matrix for the two sets of variables: the VAR variables SepalLength and SepalWidth are listed across the top of the matrix, and the WITH variables PetalLength and PetalWidth are listed down the side of the matrix. As measured in Output 2.2.4, the plot for PetalWidth and SepalLength and the plot for PetalWidth and SepalWidth also show slight positive correlations.

Note that this graphical display is requested by specifying the ODS GRAPHICS ON statement and the PLOTS option. For more information about the ODS GRAPHICS statement, see Chapter 21, Statistical Graphics Using ODS (SAS/STAT 9.22 User's Guide).
Copyright © SAS Institute, Inc. All Rights Reserved.