Previous Page | Next Page

Getting Started

Statistics

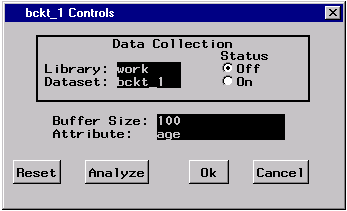
Finally, the transaction flows to a Bucket, which collects transactions and can also save the value of transaction attributes in a SAS data set.
cpbucket.gif (4051 bytes)

Figure 2.7: A Bucket Control Panel

From the bucket control panel (Figure 2.7) you can set the size of the transaction collection buffer and name the transaction attribute to accumulate. You can also name a SAS data set into which to collect the transaction attribute values.

Distribution Function Estimate

The UNIVARIATE Procedure
Variable: value

Moments
N 1803 Sum Weights 1803
Mean 24.5093328 Sum Observations 44190.3271
Std Deviation 14.8024337 Variance 219.112044
Skewness -0.1060516 Kurtosis -1.2191446
Uncorrected SS 1477915.34 Corrected SS 394839.903
Coeff Variation 60.3950903 Std Error Mean 0.34860632

Basic Statistical Measures
Location Variability
Mean 24.50933 Std Deviation 14.80243
Median 26.21585 Variance 219.11204
Mode . Range 53.62360
    Interquartile Range 26.10309

Tests for Location: Mu0=0
Test Statistic p Value
Student's t t 70.30662 Pr > |t| <.0001
Sign M 901.5 Pr >= |M| <.0001
Signed Rank S 813153 Pr >= |S| <.0001

Quantiles (Definition 5)
Quantile Estimate
100% Max 53.62741148
99% 50.95981599
95% 46.44804080
90% 43.36915659
75% Q3 37.45295397
50% Median 26.21585009
25% Q1 11.34985903
10% 3.08194661
5% 1.38985610
1% 0.28776996
0% Min 0.00381383

Extreme Observations
Lowest Highest
Value Obs Value Obs
0.00381383 1442 51.9481 819
0.02449773 1486 52.1543 818
0.02846473 1458 52.1938 418
0.04001101 1249 52.4247 419
0.06573967 1700 53.6274 817


Figure 2.8: Statistics on a Transaction Attribute

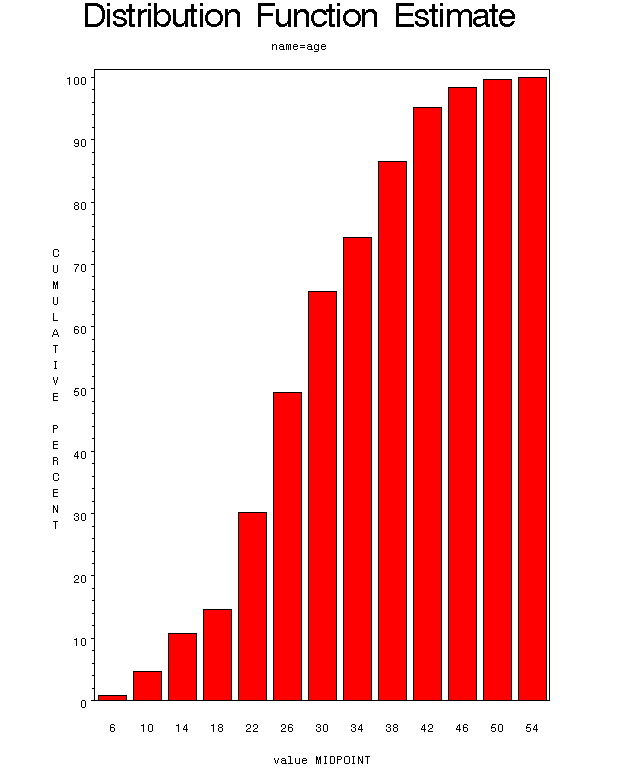
If you collect data into a SAS data set and then press the Analyze button, univariate statistics will be calculated by the UNIVARIATE procedure (Figure 2.8) and a sample distribution function as shown in Figure 2.9 will be plotted.
distribu.gif (12015 bytes)

Figure 2.9: Sample Distribution Function

See Chapter 9, "Analyzing the Sample Path," for more information about collecting statistics and analyzing simulation data.

Previous Page | Next Page | Top of Page