The GANTT Procedure
- Overview
- Getting Started
-
Syntax

-
DetailsSchedule Data SetMissing Values in Input Data SetsSpecifying the PADDING= OptionPage FormatMultiple Calendars and HolidaysFull-Screen VersionGraphics VersionSpecifying the Logic OptionsAutomatic Text AnnotationWeb-Enabled Gantt ChartsMode-Specific DifferencesDisplayed OutputMacro Variable _ORGANTTComputer Resource RequirementsODS Style Templates
-
ExamplesLine-Printer ExamplesPrinting a Gantt ChartCustomizing the Gantt ChartGraphics ExamplesMarking HolidaysMarking Milestones and Special DatesUsing the COMPRESS OptionUsing the MININTERVAL= and SCALE= OptionsUsing the MINDATE= and MAXDATE= OptionsVariable-Length HolidaysMultiple CalendarsPlotting the Actual ScheduleComparing Progress Against a Baseline ScheduleUsing the COMBINE OptionPlotting the Resource-Constrained ScheduleSpecifying the Schedule Data DirectlyBY ProcessingGantt Charts by PersonsUsing the HEIGHT= and HTOFF= OptionsDrawing a Logic Gantt Chart Using AON RepresentationSpecifying the Logic Control OptionsNonstandard Precedence RelationshipsUsing the SAS/GRAPH ANNOTATE= OptionUsing the Automatic Text Annotation FeatureMultiproject Gantt ChartsMultisegment Gantt ChartsZoned Gantt ChartsWeb-Enabled Gantt ChartsUsing the CHARTWIDTH= OptionUsing the TIMEAXISFORMAT= OptionStatement and Option Cross-Reference Tables
- References
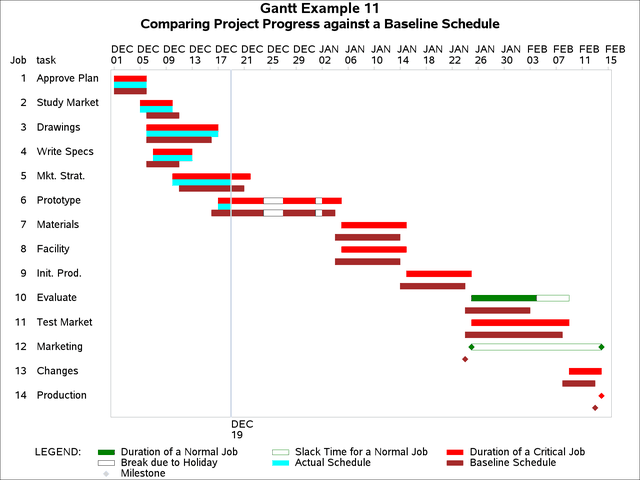
Suppose that the widget manufacturing project is currently in progress and you want to measure its performance by comparing
it with a baseline schedule. For example, the baseline schedule may be the originally planned schedule, a target schedule
that you would like to achieve, or an existing schedule that you intend to improve on. The data for this example come from
Example 4.13, which was used to illustrate the options available in PROC CPM. Prior to the beginning of the project, the predicted early
schedule is saved by PROC CPM as the baseline schedule. Progress information for the project as of December 19, 2003, is saved
in the ACTUAL data set. The variables SDATE and FDATE represent the actual start and actual finish times, respectively. The variables PCTC and RDUR represent the percent of work completed and the remaining days of work for each activity, respectively. PROC CPM is then
invoked using the baseline and project progress information with TIMENOW set to December 19, 2003. The scheduling is carried
out with the AUTOPUPDT option in order to automatically update progress information. The Schedule data set WIDGUPDT produced by PROC CPM is shown in Output 8.11.1. Notice that the development of a marketing strategy (activity 5: 'Mkt. Strategy') and the building of the prototype (activity
6: 'Prototype') have a specified value for A_START and a missing value for A_FINISH, indicating that they are currently in progress at TIMENOW.
PROC GANTT is next invoked with the data set WIDGUPDT. This data set contains the actual schedule variables A_START and A_FINISH and the baseline schedule variables B_START and B_FINISH. The Gantt chart is drawn with three schedule bars per activity. The first bar represents the predicted early/late schedule based on the actual data
specified, the second bar represents the actual schedule, and the third bar represents the baseline schedule. The TIMENOW=
option is specified in the CHART statement to draw a timenow line on December 19, 2003. Actual schedule bars for 'Mkt. Strategy' and 'Prototype' are drawn up to TIMENOW to indicate that they
are currently in progress. You can use the CTNOW=, LTNOW=, and WTNOW= options to change the color, style, and width of the
timenow line, respectively. To suppress the timenow label displayed at the bottom of the axis, specify the NOTNLABEL in the CHART statement.
title h=1.2 'Gantt Example 11';
* estimate schedule based on actual data;
proc cpm data=widgact holidata=holidays
         out=widgupdt date='1dec03'd;
   activity task;
   succ     succ1 succ2 succ3;
   duration days;
   holiday  holiday / holifin=(holifin);
   baseline / compare=early;
   actual / as=sdate af=fdate timenow='19dec03'd
            remdur=rdur pctcomp=pctc
            autoupdt;
   run;

* sort the data;
proc sort;
   by e_start;
   run;

* print the data;
title2 'Progress Data';

proc print;
   var task e_: l_: a_start a_finish b_: ;
   run;
title2 'Comparing Project Progress against a Baseline Schedule';

* plot the actual and baseline schedules using proc gantt;
proc gantt data=widgupdt holidata=holidays;
   chart / holiday=(holiday) holifin=(holifin)
           timenow='19dec03'd dur=days
           scale=2 height=1.6
           pcompress;
   id task;
   run;
Output 8.11.1: Schedule Data Set WIDGUPDT
| Gantt Example 11 |
| Progress Data |
| Obs | task | E_START | E_FINISH | L_START | L_FINISH | A_START | A_FINISH | B_START | B_FINISH |
|---|---|---|---|---|---|---|---|---|---|
| 1 | Approve Plan | 01DEC03 | 05DEC03 | 01DEC03 | 05DEC03 | 01DEC03 | 05DEC03 | 01DEC03 | 05DEC03 |
| 2 | Study Market | 05DEC03 | 09DEC03 | 05DEC03 | 09DEC03 | 05DEC03 | 09DEC03 | 06DEC03 | 10DEC03 |
| 3 | Drawings | 06DEC03 | 16DEC03 | 06DEC03 | 16DEC03 | 06DEC03 | 16DEC03 | 06DEC03 | 15DEC03 |
| 4 | Write Specs | 07DEC03 | 12DEC03 | 07DEC03 | 12DEC03 | 07DEC03 | 12DEC03 | 06DEC03 | 10DEC03 |
| 5 | Mkt. Strat. | 10DEC03 | 21DEC03 | 10DEC03 | 21DEC03 | 10DEC03 | . | 11DEC03 | 20DEC03 |
| 6 | Prototype | 17DEC03 | 04JAN04 | 17DEC03 | 04JAN04 | 17DEC03 | . | 16DEC03 | 03JAN04 |
| 7 | Materials | 05JAN04 | 14JAN04 | 05JAN04 | 14JAN04 | . | . | 04JAN04 | 13JAN04 |
| 8 | Facility | 05JAN04 | 14JAN04 | 05JAN04 | 14JAN04 | . | . | 04JAN04 | 13JAN04 |
| 9 | Init. Prod. | 15JAN04 | 24JAN04 | 15JAN04 | 24JAN04 | . | . | 14JAN04 | 23JAN04 |
| 10 | Evaluate | 25JAN04 | 03FEB04 | 30JAN04 | 08FEB04 | . | . | 24JAN04 | 02FEB04 |
| 11 | Test Market | 25JAN04 | 08FEB04 | 25JAN04 | 08FEB04 | . | . | 24JAN04 | 07FEB04 |
| 12 | Marketing | 25JAN04 | 25JAN04 | 14FEB04 | 14FEB04 | . | . | 24JAN04 | 24JAN04 |
| 13 | Changes | 09FEB04 | 13FEB04 | 09FEB04 | 13FEB04 | . | . | 08FEB04 | 12FEB04 |
| 14 | Production | 14FEB04 | 14FEB04 | 14FEB04 | 14FEB04 | . | . | 13FEB04 | 13FEB04 |