The GANTT Procedure
- Overview
- Getting Started
-
Syntax

-
DetailsSchedule Data SetMissing Values in Input Data SetsSpecifying the PADDING= OptionPage FormatMultiple Calendars and HolidaysFull-Screen VersionGraphics VersionSpecifying the Logic OptionsAutomatic Text AnnotationWeb-Enabled Gantt ChartsMode-Specific DifferencesDisplayed OutputMacro Variable _ORGANTTComputer Resource RequirementsODS Style Templates
-
ExamplesLine-Printer ExamplesPrinting a Gantt ChartCustomizing the Gantt ChartGraphics ExamplesMarking HolidaysMarking Milestones and Special DatesUsing the COMPRESS OptionUsing the MININTERVAL= and SCALE= OptionsUsing the MINDATE= and MAXDATE= OptionsVariable-Length HolidaysMultiple CalendarsPlotting the Actual ScheduleComparing Progress Against a Baseline ScheduleUsing the COMBINE OptionPlotting the Resource-Constrained ScheduleSpecifying the Schedule Data DirectlyBY ProcessingGantt Charts by PersonsUsing the HEIGHT= and HTOFF= OptionsDrawing a Logic Gantt Chart Using AON RepresentationSpecifying the Logic Control OptionsNonstandard Precedence RelationshipsUsing the SAS/GRAPH ANNOTATE= OptionUsing the Automatic Text Annotation FeatureMultiproject Gantt ChartsMultisegment Gantt ChartsZoned Gantt ChartsWeb-Enabled Gantt ChartsUsing the CHARTWIDTH= OptionUsing the TIMEAXISFORMAT= OptionStatement and Option Cross-Reference Tables
- References
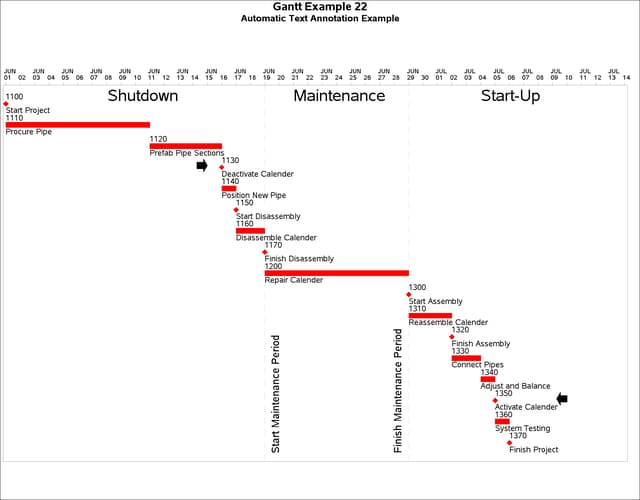
The following example is a subproject of a larger project involving the maintenance of a pipeline and steam calender (Moder,
Phillips, and Davis 1983), and it illustrates the automatic text annotation feature of the GANTT procedure. The SHUTDOWN data set is input as the activity data set to PROC CPM, and the project is scheduled to begin on June 1, 2004. PROC GANTT
is used to produce a Gantt chart of the resulting schedule with the data set LABELS specified as a Label data set; the output is shown in Output 8.22.1. The LABVAR= option in the CHART statement specifies the ACT variable as the common linking variable.
The LABSPLIT= option is specified in order to prevent the labels from splitting on embedded blanks.
The first observation in the LABELS data set causes the value of the ACT variable to be displayed at the E_START time for every activity in the project. The value of _YOFFSET='-.2' positions the baseline of the displayed text at 0.2 barheights above the top of the first bar for the activity.
Similarly the second observation displays the ID variable at the E_START time for each activity with the baseline positioned at 0.8 barheights below the bottom of the first bar for the activity.
The heights for both these strings is 1 barheight. The next two observations in the LABELS data set display the symbols corresponding to the values 'N' and 'M' in the ORFONT font, rotated at an angle of 90 degrees,
beside the milestones corresponding to the deactivation and activation of the calender, respectively. Observations 5 and 6
indicate the start and finish of the “Maintenance Period” by displaying the indicated strings rotated 90 degrees at the start and finish times of the activity 'Repair Calender.' Finally,
the last three observations provide headings for each of the three distinct regions on the chart. The _JLABEL variable is used along with the _XVAR variable to place the strings in the regions defined by the start and finish times of the 'Repair Calender' activity.
It should be noted that since the plot times are linked to variables rather than absolute values, the Label data set need not be changed even if the project is rescheduled. This is a convenient feature when monitoring a project in progress, since the annotation automatically places the labels at the appropriate times.
title c=black 'Gantt Example 22';
data shutdown;
  input act succ id & $20. dur;
  datalines;
1100 1110 Start Project         0
1110 1120 Procure Pipe         10
1120 1130 Prefab Pipe Sections  5
1130 1140 Deactivate Calender   0
1140 1150 Position New Pipe     1
1150 1160 Start Disassembly     0
1160 1170 Disassemble Calender  2
1170 1200 Finish Disassembly    0
1200 1300 Repair Calender      10
1300 1310 Start Assembly        0
1310 1320 Reassemble Calender   3
1320 1330 Finish Assembly       0
1330 1340 Connect Pipes         2
1340 1350 Adjust and Balance    1
1350 1360 Activate Calender     0
1360 1370 System Testing        1
1370 .    Finish Project        0
;
proc cpm data=shutdown date='01jun04'd interval=day
  out=sched;
  act act;
  succ succ;
  dur dur;
  id id;
run;
data labels;
  input act _y _xvar $ _lvar $ _yoffset _xoffset _label & $25.
        _alabel _hlabel _jlabel $ _flabel $ _clabel $;
  datalines;
.    -1 e_start  act -.3  0 .                           0 1.5 .   .      .
.    -1 e_start  id  2.3  0 .                           0 1.5 .   .      .
1130  . e_start  .   1.5 -1 N                          90   2 L orfont   .
1350  . e_finish .   1.5  5 M                          90   2 L orfont   .
1200 17 e_start  .   2.5  1 Start Maintenance Period   90   2 .   .      .
1200 17 e_finish .   2.5 .5 Finish Maintenance Period  90   2 .   .      .
1200  1 e_start  .     . -6 Shutdown                    0   3 R   .      .
1200  1 e_start  .     .  2 Maintenance                 0   3 L   .      .
1200  1 e_finish .     .  6 Start-Up                    0   3 L   .      .
;
title2 'Automatic Text Annotation Example';

proc gantt data=sched labdata=labels graphics maxdec=0;
  chart / pcompress nolegend nojobnum dur=dur
          mininterval=day scale=5 skip=3 maxdate='14jul04'd
          labvar=act labsplit='/' ref='19jun04'd '29jun04'd
          height=1.5 lref=20;
run;