| The NETDRAW Procedure |
Example 9.9 Time-Scaled Network Diagram
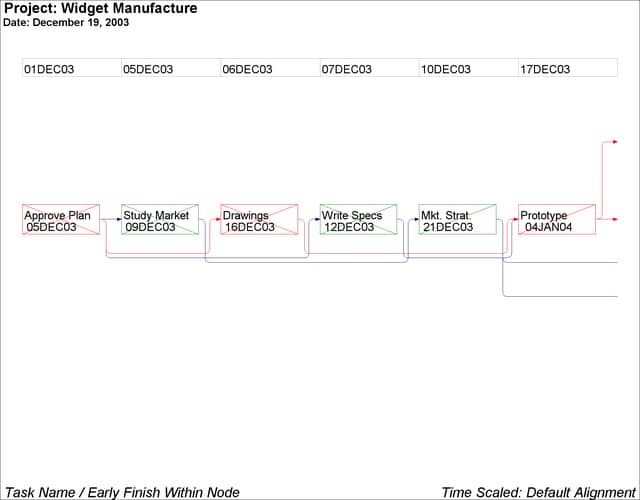
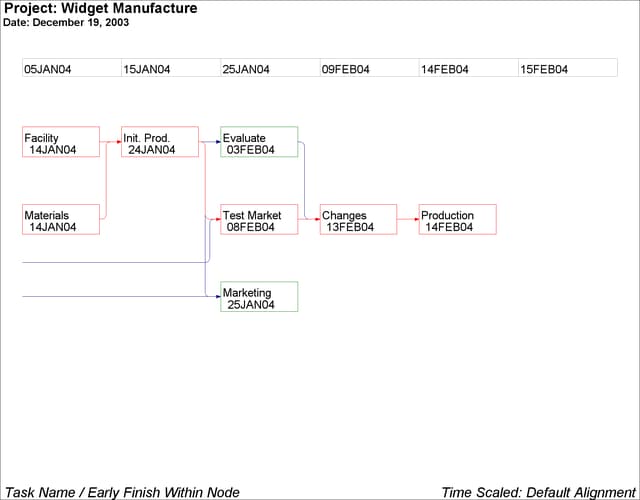
This example illustrates the use of the TIMESCALE and ALIGN= options to draw time-scaled network diagrams. The Schedule data set WIDGUPD, produced by PROC CPM in the previous example, is used. First, PROC NETDRAW is invoked with the TIMESCALE option without any ALIGN= specification. By default, the procedure aligns the nodes to coincide with the early start times of the activities. The network spans two pages(HPAGES=2 VPAGES=1), as shown in Output 9.9.1. The HMARGIN= and VMARGIN= options add extra space around the margins.
pattern1 v=e c=green;
pattern2 v=e c=red;

title  j=l h=2 ' Project: Widget Manufacture';
title2 j=l h=1.5 ' Date: December 19, 2003';
footnote j=l ' Task Name / Early Finish Within Node'
         j=r  'Time Scaled: Default Alignment ';
proc netdraw data=widgupd graphics;
   actnet / act=task
            succ=(succ1 succ2 succ3)
            ybetween = 8
            separatearcs
            novcenter
            id=(task e_finish) nodefid
            nolabel
            showstatus
            carcs=darkblue
            ccritarcs=red
            vmargin=5
            hmargin=5
            timescale
            htext=2  pcompress
            hpages=2 vpages=1
            nopagenumber;
   run;


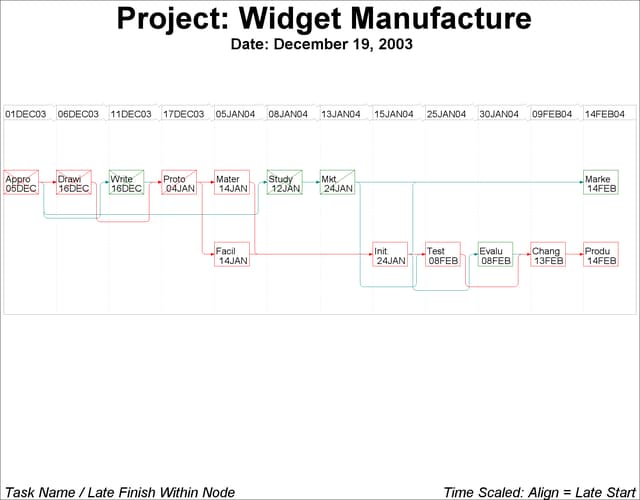
Next, PROC NETDRAW is invoked with several of the time-scale options:
The ALIGN= option requests that the activities be placed according to the L_START times.
The FRAME option produces a border around the network diagram.
The AUTOREF option draws reference lines at every tick mark.
The LREF= and CREF= options specify the line style and color for the reference lines.
The SHOWBREAK option requests that breaks in the time axis be indicated by breaks before the corresponding tick marks.
footnote j=l ' Task Name / Late Finish Within Node'
         j=r 'Time Scaled: Align = Late Start ';
proc netdraw data=widgupd graphics;
   actnet / act=task
            succ=(succ1 succ2 succ3)
            ybetween = 10
            separatearcs
            pcompress
            novcenter
            id=(task l_finish) nodefid
            nolabel
            boxwidth=5
            showstatus
            carcs=darkcyan
            ccritarcs=red
            vmargin=10
            align=l_start
            frame
            autoref
            lref=33
            cref=darkcyan
            showbreak
            htext=2;
   run;

Copyright © SAS Institute, Inc. All Rights Reserved.