| The NETDRAW Procedure |
Example 9.5 Controlling the Display Format
In addition to the COMPRESS and PCOMPRESS options and the HPOS= and VPOS= global options, you can control the amount of information displayed on a single page by
turning off the default ID variable selection (using the NODEFID option) and using the ID= option to select only a few variables of interest in the Network data set
setting the dimensions of each node using the BOXWIDTH= and the BOXHT= options
specifying the horizontal and vertical distances between nodes using the XBETWEEN= and YBETWEEN= options, respectively
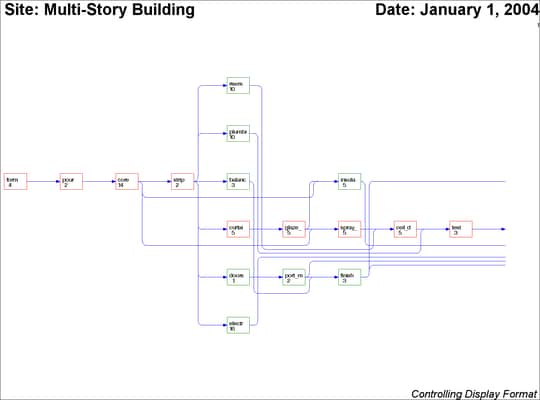
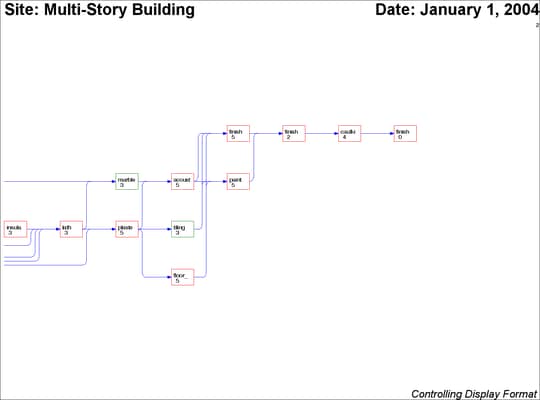
This example uses the data from Example 6.1 in Chapter 6, The GANTT Procedure, and some of the options just mentioned to produce the network diagram shown in Output 9.5.1. The ID= and NODEFID options are used to display only the activity name and duration values within each node. The NOLABEL option suppresses the display of the variable names within each node. Some of the activity names are truncated by the BOXWIDTH= option. Even with the restrictions imposed, the network is too large to fit on one page and spans two pages. Note that on devices with higher resolution, you can increase the values of HPOS and VPOS (still maintaining readability) to enable more of the network to be drawn on one page.
data ex  ;
   format activity $20. success1 $20. success2 $20. success3 $20.
                        success4 $20.;
   input activity dur success1-success4;
   datalines;
form                 4 pour . . .
pour                 2 core . . .
core                14 strip spray_fireproof insulate_walls .
strip                2 plumbing curtain_wall risers doors
strip                2 electrical_walls balance_elevator . .
curtain_wall         5 glaze_sash . . .
glaze_sash           5 spray_fireproof insulate_walls . .
spray_fireproof      5 ceil_ducts_fixture . . .
ceil_ducts_fixture   5 test . . .
plumbing            10 test . . .
test                 3 insulate_mechanical . . .
insulate_mechanical  3 lath . . .
insulate_walls       5 lath . . .
risers              10 ceil_ducts_fixture . . .
doors                1 port_masonry . . .
port_masonry         2 lath finish_masonry . .
electrical_walls    16 lath . . .
balance_elevator     3 finish_masonry . . .
finish_masonry       3 plaster marble_work . .
lath                 3 plaster marble_work . .
plaster              5 floor_finish tiling acoustic_tiles .
marble_work          3 acoustic_tiles . . .
acoustic_tiles       5 paint finish_mechanical . .
tiling               3 paint finish_mechanical . .
floor_finish         5 paint finish_mechanical . .
paint                5 finish_paint . . .
finish_mechanical    5 finish_paint . . .
finish_paint         2 caulking_cleanup . . .
caulking_cleanup     4 finished . . .
finished             0 . . . .
;
proc cpm finishbefore date='1jan04'd out=sched;
   activity activity;
   duration dur;
   successors success1-success4;
   run;

proc sort;
   by e_start;
   run;
goptions hpos=130 vpos=75 border;

pattern1 v=e c=green;
pattern2 v=e c=red;

title j=l h=3  ' Site: Multi-Story Building'
      j=r ' Date: January 1, 2004';
footnote j=r h=2 'Controlling Display Format ';
proc netdraw data=sched graphics;
   actnet / act = activity
            succ = (success1-success4)
            font=swiss
            id = ( activity dur )
            nolabel nodefaultid
            boxwidth = 6
            ybetween = 6
            separatearcs;
   run;
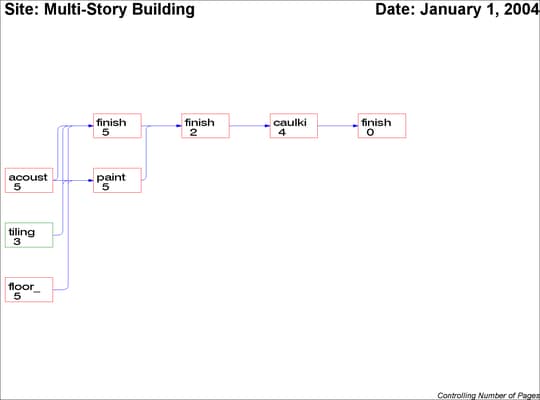
You can also control the format of the display by specifying the number of pages into which the network diagram should be split. You can do this by
using the HPAGES= and VPAGES= options, which specify the number of pages in the horizontal and vertical directions, respectively
setting the number of nodes in the horizontal and vertical directions using the NXNODES= and NYNODES= options, respectively
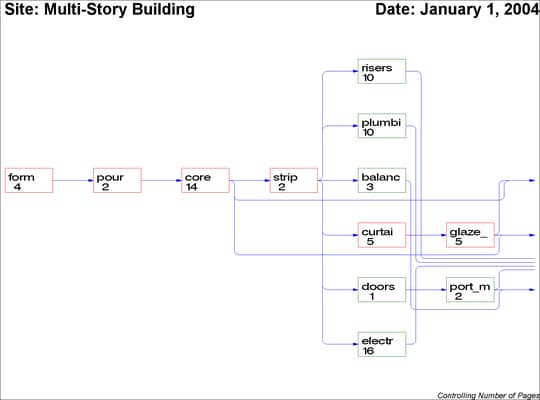
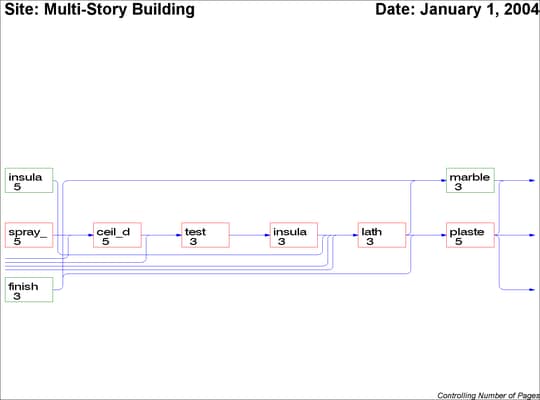
The following statements invoke PROC NETDRAW with some additional page control options. The HTEXT= option is also used to control the height of the text used in the diagram.
footnote j=r h=1.5 'Controlling Number of Pages';
proc netdraw data=sched graphics;
   actnet / act = activity
            succ = (success1-success4)
            font=swiss
            id = ( activity dur )
            nolabel nodefaultid
            boxwidth = 6
            ybetween = 6
            separatearcs
            htext=2
            nopagenumber
            hpages=3 vpages=1;
   run;
Copyright © SAS Institute, Inc. All Rights Reserved.