| Introduction to Project Management |
Example 3.1 Project Definition
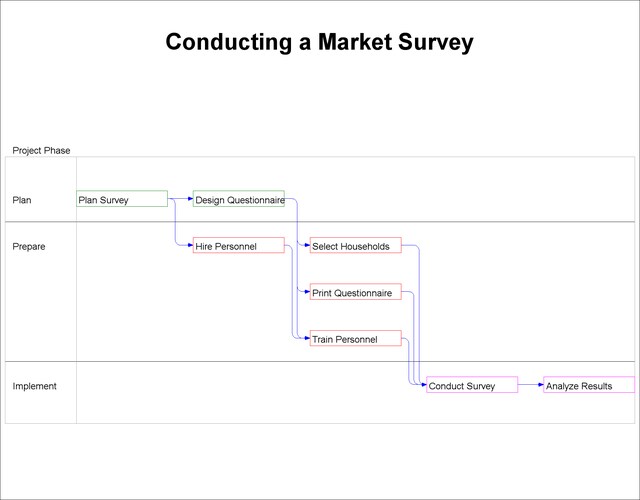
Suppose you want to prepare and conduct a market survey (Moder, Phillips, and Davis 1983) to determine the desirability of launching a new product. As a first step, you need to identify the steps involved. Make a list of the tasks that need to be performed and obtain a reasonable estimate of the length of time needed to perform each task. Further, you need to specify the order in which these tasks can be done. The following DATA step creates a SAS data set, survey, representing the project. This Activity data set contains a representation of the Survey project in Activity-On-Node format; a brief discussion of the two types of representations is given in Chapter 2, The CPM Procedure. The data set contains a variable activity listing the basic activities (tasks) involved, a variable duration specifying the length of time in days needed to perform the tasks, and, for each task, the variables succ1–succ3, which indicate the immediate successors. An ID variable is also included to provide a more informative description of each task. Thus, the activity 'Plan Survey' takes four days. Once the planning is done, the tasks 'Hire Personnel' and 'Design Questionnaire' can begin. The Activity data set also contains a variable named phase associating each activity with a particular phase of the project.
data survey;
   input id        $ 1-20
         activity  $ 22-29
         duration
         succ1     $ 34-41
         succ2     $ 43-50
         succ3     $ 52-59
         phase     $ 61-69;
   label phase = 'Project Phase'
         id    = 'Description';
   datalines;
Plan Survey          plan sur 4  hire per design q          Plan
Hire Personnel       hire per 5  trn per                    Prepare
Design Questionnaire design q 3  trn per  select h print q  Plan
Train Personnel      trn per  3  cond sur                   Prepare
Select Households    select h 3  cond sur                   Prepare
Print Questionnaire  print q  4  cond sur                   Prepare
Conduct Survey       cond sur 10 analyze                    Implement
Analyze Results      analyze  6                             Implement
;
The data set survey can be input to PROC CPM, which calculates how long the project will take given the current estimates of the durations. As a first step, you may want to graph the project network using PROC NETDRAW. In the initial stages of defining the tasks in a project, it is useful to see how the tasks relate to each other and perhaps modify some of the relationships. The following program invokes PROC NETDRAW; the ZONE= option is used to create a zoned network diagram with the activities grouped according to the phase of the project to which they correspond. The network diagram is shown in Output 3.1.1.
goptions hpos=100 vpos=65 border;
pattern1 v=e c=green;
pattern2 v=e c=red;
pattern3 v=e c=magenta;

title ' ';
title2 h=3 'Conducting a Market Survey';

proc netdraw data=survey graphics;
   actnet/act=activity
          succ=(succ1-succ3)
          separatearcs
          xbetween=3 pcompress
          id=(id)
          height=1.5
          nodefid
          nolabel
          zone=phase
          zonepat
          frame;
   run;
Copyright © SAS Institute, Inc. All Rights Reserved.