| The GANTT Procedure |
Example 8.7 Using the MINDATE= and MAXDATE= Options
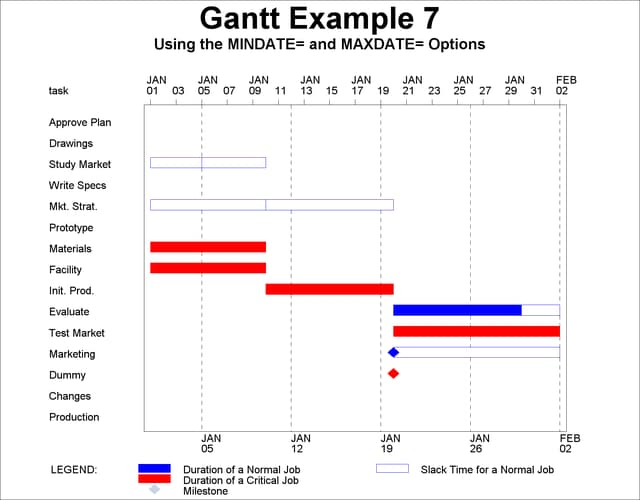
In this example, the SAVE data set from Example 8.6 is used to display the schedule of the project over a limited time period. The start date and end date are specified by the MINDATE= and MAXDATE= options, respectively, in the CHART statement. As in Example 8.5, the COMPRESS option is used to ensure that the region of the Gantt chart lying between January 1, 2004, and February 2, 2004, fits on a single page. The specification REF='5JAN04'D TO '2FEB04'D BY WEEK causes PROC GANTT to draw reference lines at the start of every week. Further, the reference lines are labeled using the REFLABEL option. The CREF= and LREF= options are specified in the CHART statement to indicate the color and line style, respectively, of the reference lines. The resulting Gantt chart is shown in Output 8.7.1.
title 'Gantt Example 7';
title2 'Using the MINDATE= and MAXDATE= Options';
goptions vpos=40 hpos=100;

* plot the schedule;
proc gantt graphics data=save;
   chart / mindate='1jan04'd maxdate='2feb04'd
           ref='5jan04'd to '2feb04'd by week
           reflabel cref=black lref=2 caxis=black
           compress dur=days nojobnum;
   id task;
   run;
Copyright © SAS Institute, Inc. All Rights Reserved.