| The GANTT Procedure |
Getting Started: GANTT Procedure
In order to draw a Gantt chart, at the very minimum you need a Schedule data set. This data set is expected to be similar to the OUT= Schedule data set produced by PROC CPM, with each observation representing an activity in the project. It is possible to obtain a detailed Gantt chart by specifying the following single statement:
- PROC GANTT DATA= SAS-data-set ;
The data set specified is the Schedule data set produced by PROC CPM.
As an example of this, consider the software development project in the "Getting Started" section in Chapter 2, The CPM Procedure. The output schedule for this example is saved in a data set, INTRO1, which is displayed in Figure 8.1.
| Project Schedule |
| Obs | activity | succesr1 | succesr2 | duration | descrpt | E_START | E_FINISH | L_START | L_FINISH | T_FLOAT | F_FLOAT |
|---|---|---|---|---|---|---|---|---|---|---|---|
| 1 | TESTING | RECODE | 20 | Initial Testing | 01MAR04 | 20MAR04 | 01MAR04 | 20MAR04 | 0 | 0 | |
| 2 | PRELDOC | DOCEDREV | QATEST | 15 | Prel. Documentation | 01MAR04 | 15MAR04 | 11MAR04 | 25MAR04 | 10 | 10 |
| 3 | MEETMKT | RECODE | 1 | Meet Marketing | 01MAR04 | 01MAR04 | 20MAR04 | 20MAR04 | 19 | 19 | |
| 4 | RECODE | DOCEDREV | QATEST | 5 | Recoding | 21MAR04 | 25MAR04 | 21MAR04 | 25MAR04 | 0 | 0 |
| 5 | QATEST | PROD | 10 | QA Test Approve | 26MAR04 | 04APR04 | 26MAR04 | 04APR04 | 0 | 0 | |
| 6 | DOCEDREV | PROD | 10 | Doc. Edit and Revise | 26MAR04 | 04APR04 | 26MAR04 | 04APR04 | 0 | 0 | |
| 7 | PROD | 1 | Production | 05APR04 | 05APR04 | 05APR04 | 05APR04 | 0 | 0 |
The following code produces the Gantt chart shown in Figure 8.2.
proc gantt lineprinter data=intro1;
run;
The DATA= option could be omitted if the INTRO1 data set is the most recent data set created; by default, PROC GANTT uses the _LAST_ data set.
| Line-Printer Gantt Chart |
                       MAR   MAR   MAR   MAR   MAR   MAR   APR
                Job    01 04 07 10 13 16 19 22 25 28 31 03 06
                      -+--+--+--+--+--+--+--+--+--+--+--+--+-
                      |                                     |
                  1   |*===================*                |
                      |                                     |
                  2   |<---------<---->.........>           |
                      |                                     |
                  3   |<>.................<>                |
                      |                                     |
                  4   |                    *====*           |
                      |                                     |
                  5   |                         *=========* |
                      |                                     |
                  6   |                         *=========* |
                      |                                     |
                  7   |                                   **|
                      |                                     |
                      -+--+--+--+--+--+--+--+--+--+--+--+--+-


                                   LEGEND


                   Symbol     Explanation

                   <---->     Duration of a Normal Job

                   >....>     Slack Time for a Normal Job

                   *====*     Duration of a Critical Job
|
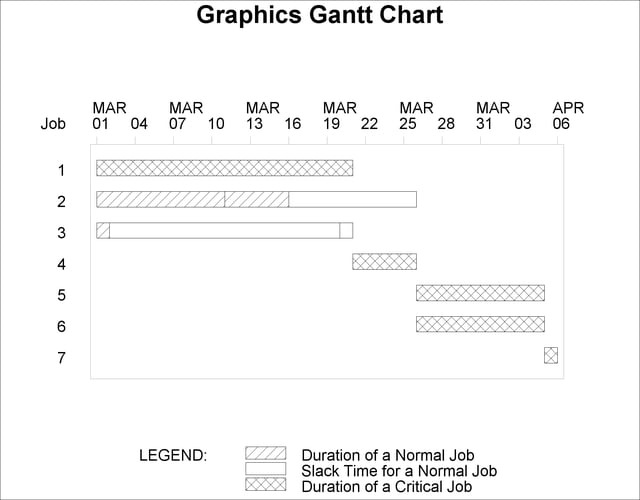
You can produce a high-resolution graphics quality Gantt chart by specifying the GRAPHICS option instead of the LINEPRINTER option in the PROC GANTT statement. Graphics mode is also the default display mode. The resulting Gantt chart is shown in Figure 8.3.
proc gantt graphics data=intro1;
run;
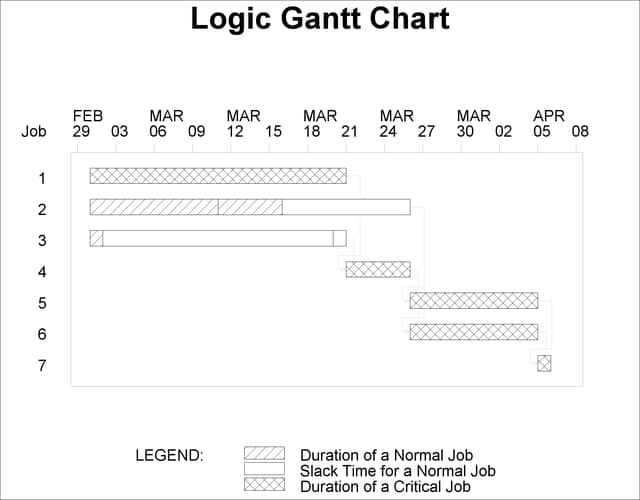
Finally, you can draw a Logic Gantt chart by defining the precedence information to PROC GANTT in AON format using the ACTIVITY= and SUCCESSOR= options in the CHART statement. The Logic Gantt chart is shown in Figure 8.4.
proc gantt data=intro1;
   chart / activity=activity successor=(succesr1-succesr2);
run;
For further examples illustrating typical invocations of the GANTT procedure when managing projects, see Chapter 1, Introduction to Project Management.
Copyright © SAS Institute, Inc. All Rights Reserved.