| The Projman Application |
Report Options Window
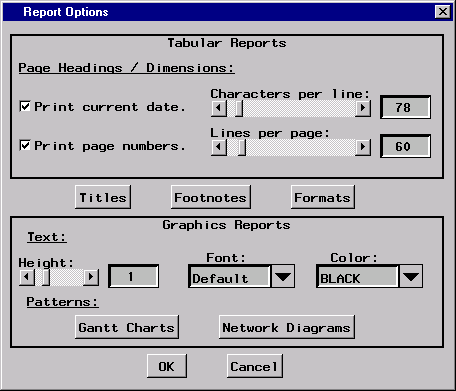
The Report Options window provides access to various options for both tabular and graphic quality reports. You can modify output appearance features such as page headings, titles, and footnotes as well as colors and fonts. These options affect all reports generated with the Projman application.
|
Tabular Report Options
Print current date.
When this check box is selected, the current date is displayed in the upper-right corner of each page of all tabular (nongraphics quality) reports.Print page numbers.
When this check box is selected, page numbers are displayed in the upper-right corner of each page of all tabular (nongraphics quality) reports.Characters per line
The horizontal slider can be used to specify the width of pages of tabular (nongraphics quality) reports. The number of characters per line must be an integer value between 64 and 256.Lines per page
The horizontal slider can be used to specify the length of pages of tabular (nongraphics quality) reports. The number of lines per page must be an integer value between 15 and 512.Titles
When the Titles button is clicked, a window is displayed for specifying one or more titles for project reports. You can customize any of your output from reports by adding up to four titles to the top of each page.To create or modify a title, simply click the button corresponding to the title you want to modify. For each title, you can specify the type, color, and size of the font as well as the justification used to align the text. Note that the type, color, size, and justification specifications are used only when producing graphics-quality reports.
Footnotes
When the Footnotes button is clicked, a window is displayed for specifying one or more footnotes for project reports. You can customize any of your output from reports by adding up to four footnotes to the bottom of each page.To create or modify a footnote, simply click the button corresponding to the footnote you want to modify. For each footnote, you can specify the type, color, and size of the font as well as the justification used to align the text. Note that the type, color, size, and justification specifications are used only when producing graphics-quality reports.
Formats
When the Formats button is clicked, a window is displayed for selecting the format to be used for displaying project schedules. You can specify whether reports are to display schedules using a DATE7. (that is, 01MAY04) or a DATETIME13. (that is, 01MAY04:12:00) format.Graphics Report Options
Height
The horizontal slider can be used to specify the default height to be used for all text displayed in graphics-quality reports. The default value is 1, and valid values range from 0.1 to 5.Font
The Font box can be used to specify the default font to be used for all text displayed in graphics-quality reports.Color
The Color box can be used to specify the default color to be used for all text displayed in graphics-quality reports.Gantt Chart Patterns
Clicking the Gantt Charts button opens a window where you can specify the colors and fill patterns of the activity bars drawn on graphics-quality Gantt charts.The various types of activity bars, along with their respective colors and fill patterns, are listed in the window. To modify the attributes for a particular activity bar, simply click the corresponding color or fill pattern, and a selection window is opened. From that window, select the desired color or fill pattern.
Network Diagram Patterns
Clicking the Network Diagrams button opens a window where you can specify the colors and fill patterns of the activity nodes drawn on graphics-quality network diagram reports.The various types of activity nodes, along with their respective colors and fill patterns, are listed in the window. To modify the attributes for a particular activity node, click the corresponding color or fill pattern, and a selection window is opened. From that window, select the desired color or fill pattern.
Copyright © 2008 by SAS Institute Inc., Cary, NC, USA. All rights reserved.