| The NETDRAW Procedure |
Example 7.14: Specifying Node Positions
This example uses a typical problem in network flow optimization to
illustrate how you can use PROC NETDRAW to draw a network
by specifying completely all the node positions. Consider a simple
two-period production inventory problem with one manufacturing plant
(PLANT),
two warehouses (DEPOT1 and DEPOT2), and one customer (CUST). In each
period, the customer can receive goods directly from the plant or from
the two warehouses. The goods produced at the plant can be used to
satisfy directly some or all of the customer's demands or can
be shipped to a warehouse. Some of the goods can
also be carried over to the next period
as inventory at the plant. The problem is
to determine the minimum cost of satisfying the customer's
demands; in particular, how much of the customer's demands
in each period is to be satisfied from the inventory at the
two warehouses or from the plant,
and also how much of the production is to be carried over as inventory
at the plant? This problem can be solved using PROC NETFLOW; the
details are not discussed here.
Let PLANT_i represent the production at the plant in
period i, DEPOT1_i represent the inventory at
DEPOT1 in period i, DEPOT2_i represent the
inventory at DEPOT2 in period i, and
CUST_i represent the customer's demand in period
i
(i =1, 2). These variables can be
thought of
as nodes in a network with the following data representing the
COST and CAPACITY of the arcs connecting them:
           FROM      TO          COST    CAPACITY

           PLANT_1   CUST_1       10        75
           PLANT_1   DEPOT1_1      7        75
           PLANT_1   DEPOT2_1      8        75
           DEPOT1_1  CUST_1        3        20
           DEPOT2_1  CUST_1        2        10
           PLANT_1   PLANT_2       2       100
           DEPOT1_1  DEPOT1_2      1       100
           DEPOT2_1  DEPOT2_2      1       100
           PLANT_2   CUST_2       10        75
           PLANT_2   DEPOT1_2      7        75
           PLANT_2   DEPOT2_2      8        75
           DEPOT1_2  CUST_2        3        20
           DEPOT2_2  CUST_2        2        10
           CUST_1    .             .         .
           CUST_2    .             .         .
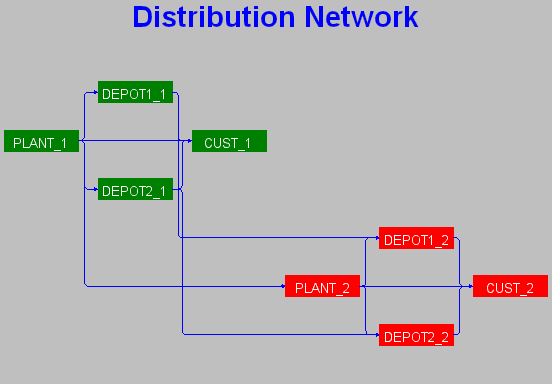
Suppose that you want to use PROC NETDRAW to draw the network corresponding to the preceding network flow problem and suppose also that you require the nodes to be placed in specific positions. The following program saves the network information along with the required node coordinates in the Network data set ARCS and invokes PROC NETDRAW to draw the network diagram shown in Output 7.14.1. The Network data set also contains a variable named _pattern, which specifies that pattern statement 1 be used for nodes relating to period 1 and pattern statement 2 be used for those relating to period 2.
    data arcs;
       input from $  to $  _x_ _y_ _pattern;
       datalines;
    PLANT_1  CUST_1      1  5  1
    PLANT_1  DEPOT1_1    1  5  1
    PLANT_1  DEPOT2_1    1  5  1
    DEPOT1_1 CUST_1      2  6  1
    DEPOT2_1 CUST_1      2  4  1
    PLANT_1  PLANT_2     1  5  1
    DEPOT1_1 DEPOT1_2    2  6  1
    DEPOT2_1 DEPOT2_2    2  4  1
    PLANT_2  CUST_2      4  2  2
    PLANT_2  DEPOT1_2    4  2  2
    PLANT_2  DEPOT2_2    4  2  2
    DEPOT1_2 CUST_2      5  3  2
    DEPOT2_2 CUST_2      5  1  2
    CUST_1     .         3  5  1
    CUST_2     .         6  2  2
    ;

    pattern1 v=s  c=green;
    pattern2 v=s  c=red;

    title c=blue 'Distribution Network';
    proc netdraw data=arcs graphics out=netout;
       actnet / act=from
                succ=to
                separatearcs
                ybetween = 4
                centerid
                ctext = white
                carcs = blue
                htext=2
                pcompress;
       run;
Note: This network diagram can also be drawn by using suitably defined ZONE and ALIGN variables.
|
Copyright © 2008 by SAS Institute Inc., Cary, NC, USA. All rights reserved.