| The DTREE Procedure |
Example 5.3: Contract Bidding Problem
This example illustrates the use of several of the graphics options for producing graphics quality decision tree diagrams.
The production manager of a manufacturing company is planning to bid on a project to manufacture a new type of machine. He has the choice of bidding low or high. The evaluation of the bid will more likely be favorable if the bidder has built a prototype of the machine and includes it with the bid. However, he is uncertain about the cost of building the prototype. His technical staff has provided him a probability distribution on the cost of the prototype.
Table 5.33: Probability on the Cost of Building Prototype| Outcome | Cost | Probability |
| Expensive | $ | 0.4 |
| Moderate | $ | 0.5 |
| Inexpensive | $ | 0.1 |
There is also uncertainty in whether he will win the contract or
not. He has estimated the probability distribution of winning
the contract as shown in Table 5.34.
| Events | |||
| Givens | Win the Contract | Lose the Contract | |
| Build Prototype | High Bid | 0.4 | 0.6 |
| Build Prototype | Low Bid | 0.8 | 0.2 |
| No Prototype | High Bid | 0.2 | 0.8 |
| No Prototype | Low Bid | 0.7 | 0.3 |
In addition, the payoffs of this bidding venture
are affected by the cost of building the
prototype. Table 5.35 shows his payoffs.
The first row of the table shows the payoff is
if he loses the contract, regardless of whether or not he builds the
prototype and whether he bids low or high.
The remainder of the entries in the table give the payoff under
the various scenarios.
| States | Actions | ||
| Result | Cost | Bid low | Bid high |
| Lose the Contract | |||
| Win the Contract | $ | $ | |
| Win the Contract | Expensive | $ | $ |
| Win the Contract | Moderate | $ | $ |
| Win the Contract | Inexpensive | $ | $ |
The production manager must decide whether to build the
prototype and how to bid.
He uses PROC DTREE to help him to make these decisions.
The structure of the model is stored in the
STAGEIN= data set
named Stage3.
There are two decision stages, 'Choose' and 'Bid', and two
chance stages, 'Cost_Prototype' and 'Contract'.
The 'Choose' stage represents the decision
whether or not to build a prototype. The chance stage
'Cost_Prototype' represents the uncertain cost for building a
prototype. It can be 'Expensive', which costs $![]() , or
, or
'Moderate', which costs $![]() , or
, or 'Inexpensive', which costs
$![]() . The
. The 'Bid' stage represents the decision whether to
bid high or bid low. The last stage, 'Contract', represents
the result, either win the contract or lose the contract.
     /* -- create the STAGEIN= data set                    -- */
    data Stage3;
       format _STNAME_ $14. _STTYPE_ $2. _OUTCOM_ $15.
              _SUCCES_ $14. _REWARD_ dollar8.0 ;
       input _STNAME_ $16. _STTYPE_ $4. _OUTCOM_ $16.
             _SUCCES_ $16. _REWARD_ dollar8.0 ;
       datalines;
    Choose          D   Build_Prototype Cost_Prototype       .
    .               .   No_Prototype    Bid                  .
    Cost_Prototype  C   Expensive       Bid              -$4,500
    .               .   Moderate        Bid              -$2,500
    .               .   Inexpensive     Bid              -$1,000
    Bid             D   High_Bid        Contract             .
    .               .   Low_Bid         Contract             .
    Contract        C   Win_Contract    .                    .
    .               .   Lose_Contract   .                    .
    ;
The PROBIN= data set, named Prob3, contains the probability information as in Table 5.33 and Table 5.34.
     /* -- create the PROBIN= data set                     -- */
    data Prob3;
       format _GIVEN1_ $15. _GIVEN2_ $15. _EVENT_ $14. ;
       input (_GIVEN1_ _GIVEN2_ _EVENT_) ($) _PROB_;
       datalines;
    .               .               Expensive       0.4
    .               .               Moderate        0.5
    .               .               Inexpensive     0.1
    Build_Prototype High_Bid        Win_Contract    0.4
    Build_Prototype High_Bid        Lose_Contract   0.6
    Build_Prototype Low_Bid         Win_Contract    0.8
    Build_Prototype Low_Bid         Lose_Contract   0.2
    No_Prototype    High_Bid        Win_Contract    0.2
    No_Prototype    High_Bid        Lose_Contract   0.8
    No_Prototype    Low_Bid         Win_Contract    0.7
    No_Prototype    Low_Bid         Lose_Contract   0.3
    ;
The PAYOFFS= data set named Payoff3 contains the
payoff information as in Table 5.35.
Notice that the payoff to outcome 'Lose_Contract'
is not in the data set Payoff3. Since PROC DTREE
assigns the default value to all scenarios that are not
in the PAYOFFS= data set, it is not necessary
to include it.
     /* -- create the PAYOFFS= data set                    -- */
    data Payoff3;
       format _STATE1_ _STATE2_ $12.;
       input (_STATE1_ _STATE2_ _ACTION_) ($16.)
             _VALUE_  dollar8.0;
       datalines;
    Win_Contract    .               Low_Bid         $35,000
    Win_Contract    .               High_Bid        $75,000
    Win_Contract    Expensive       Low_Bid         $25,000
    Win_Contract    Expensive       High_Bid        $65,000
    Win_Contract    Moderate        Low_Bid         $35,000
    Win_Contract    Moderate        High_Bid        $75,000
    Win_Contract    Inexpensive     Low_Bid         $45,000
    Win_Contract    Inexpensive     High_Bid        $85,000
    ;
The solution, as in Output 5.3.1, is displayed on a graphics
device with the following code.
Notice that the title is specified before invoking PROC DTREE.
The GRAPHICS option is given on the
PROC DTREE statement.
Specifying the COMPRESS option in the
TREEPLOT statement
causes the decision tree diagram to be drawn completely on one page.
The vertical distance between two successive end nodes is 1
character cell (ybetween=1 cell).
All text, except that in the first title line, is drawn with the font
specified by the FTEXT= option and height specified
by the HTEXT= option.
The height for all nodes is the number of character cells specified
by the HSYMBOL= option.
The thickness for all links in the diagram, except those that
represent optimal decisions, is specified by the LWIDTH=
option. The thickness of the links that represent
optimal decisions is specified
by the LWIDTHB= option,
and the type of those
links is 3 (lstyleb=3), the dash line.
Colors for the text, links and nodes, and symbols to be
used for nodes are not specified and hence defaults are used.
       /* -- define title                               -- */
    title1 h=2 "Contract Bidding Example" ;

       /* -- define graphics options                    -- */
    goptions colors=(black red blue green);
    goptions hsize=8 in vsize=8.4 in;

       /* -- PROC DTREE statements                      -- */
    proc dtree stagein=Stage3 probin=Prob3 payoffs=Payoff3
         graphics
         nowarning
         ;
       evaluate;
       treeplot / name="dt3" compress ybetween=1 cell
                  hsymbol=3 ftext='Cumberland AMT'
                  lstyleb=3 lwidth=2 lwidthb=3;
    quit;
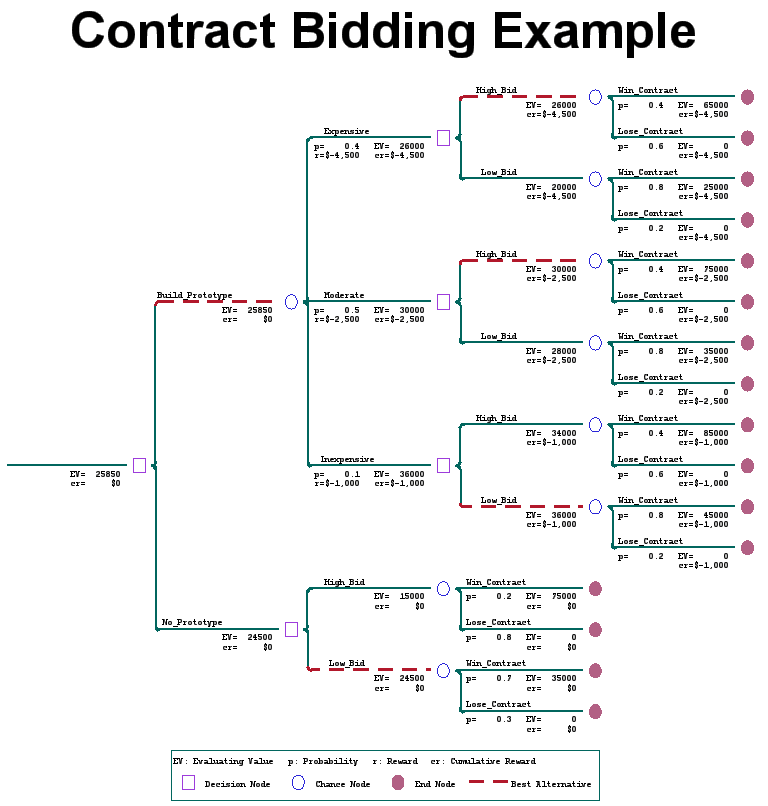
Output 5.3.1: Decision Tree for the Contract Bidding Problem
|
With the information on this decision tree, the production manager can select the optimal bidding strategy:
- He should build a prototype to accompany the bid and always bid
high unless the cost for building the prototype is as
low as $
 . This optimal strategy yields an
expected return of $
. This optimal strategy yields an
expected return of $ .
. - If no prototype is built, the preferred decision is
to make a low bid. In this case the expected return
is $
 .
.
Copyright © 2008 by SAS Institute Inc., Cary, NC, USA. All rights reserved.