| The CPM Procedure |
Example 2.5: Precedence Gantt Chart
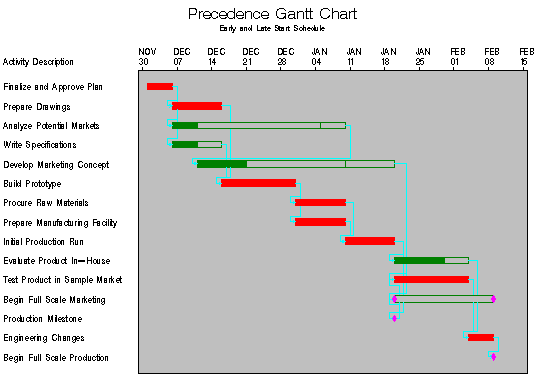
This example produces a Gantt chart of the schedule obtained from PROC CPM. The example uses the network described in Example 2.2 (AOA format) and assumes that the data set SAVE contains the schedule produced by PROC CPM and sorted by the variable E_START. The Gantt chart produced shows the early and late start schedules as well as the precedence relationships between the activities. The precedence information is conveyed to PROC GANTT through the TAILNODE= and HEADNODE= options.
    * specify the device on which you want the chart printed;

    goptions vpos=50 hpos=80 border;

    title f=swiss 'Precedence Gantt Chart';
    title2 f=swiss 'Early and Late Start Schedule';
    proc gantt graphics data=save;
       chart / compress tailnode=tail headnode=head
               font=swiss height=1.5 nojobnum skip=2
               cprec=cyan cmile=magenta
               caxis=black cframe=ligr
               dur=days increment=7 nolegend;
       id descrpt;
       run;
Output 2.5.1: Gantt Chart of Project
|
Copyright © 2008 by SAS Institute Inc., Cary, NC, USA. All rights reserved.