| The NETFLOW Procedure |
Example 5.2: Minimum Cost Flow Problem
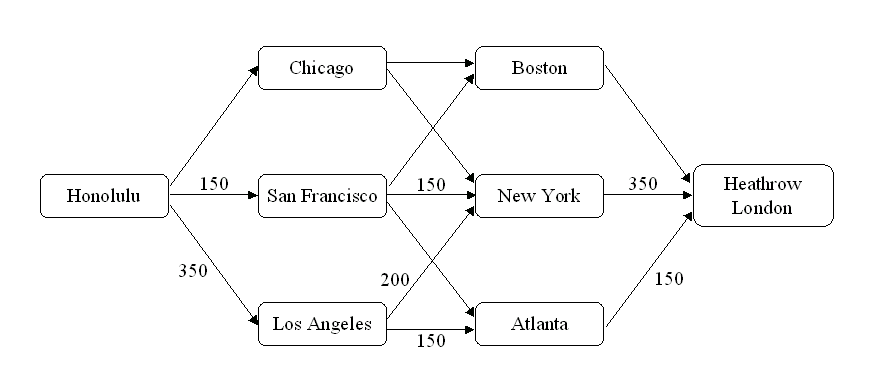
You can continue to use the pineapple example in Example 5.1 by supposing that the airlines now stipulate that no more than 350 pineapples per week can be handled in any single leg of the journey. The restaurant uses 500 pineapples each week. How many pineapples should take each route between Hawaii and London?
You will probably have more minimum cost flow problems because they are more general than maximal flow and shortest path problems. A shortest path formulation is no longer valid because the sink node does not demand one flow unit.
All arcs have the same capacity of 350 pineapples. Because of this, the DEFCAPACITY= option can be specified in the PROC NETFLOW statement, rather than having a CAPACITY list variable in ARCDATA=aircost1. You can have a CAPACITY list variable, but the value of this variable would be 350 in all observations, so using the DEFCAPACITY= option is more convenient. You would have to use the CAPACITY list variable if arcs had differing capacities. You can use both the DEFCAPACITY= option and a CAPACITY list variable.
There is only one supply node and one demand node. These can be named in the SOURCE= and SINK= options. DEMAND=500 is specified for the restaurant demand. There is no need to specify SUPPLY=500, as this is assumed.
   title 'Minimum Cost Flow Problem';
   title2 'How to get Hawaiian Pineapples to a London Restaurant';
   proc netflow
      defcapacity=350
      sourcenode='Honolulu'
      sinknode='Heathrow London'  /* Quotes for embedded blank */
      demand=500
         arcdata=aircost1
         arcout=arcout1
         nodeout=nodeout1;
            tail    ffrom;
            head    tto;
      set future1;
   proc print data=arcout1; sum _fcost_;
   proc print data=nodeout1;
   run;
The following notes appear on the SAS log:
   NOTE: SOURCENODE was assigned supply of the total
         network demand= 500 .
   NOTE: Number of nodes= 8 .
   NOTE: Number of supply nodes= 1 .
   NOTE: Number of demand nodes= 1 .
   NOTE: Total supply= 500 , total demand= 500 .
   NOTE: Number of arcs= 13 .
   NOTE: Number of iterations performed (neglecting any
         constraints)= 6 .
   NOTE: Of these, 4 were degenerate.
   NOTE: Optimum (neglecting any constraints) found.
   NOTE: Minimal total cost= 93750 .
   NOTE: The data set WORK.ARCOUT1 has 13 observations and
         13 variables.
   NOTE: The data set WORK.NODEOUT1 has 9 observations and
         10 variables.

|
Figure 5.41: Pineapple Routes: Minimum Cost Flow Solution
The routes and numbers of pineapples in each arc can be seen in
the output data set ARCOUT=arcout1 in Output 5.2.1.
NODEOUT=NODEOUT1
is shown in Output 5.2.2.
Output 5.2.2: NODEOUT=NODEOUT1
|
Copyright © 2008 by SAS Institute Inc., Cary, NC, USA. All rights reserved.