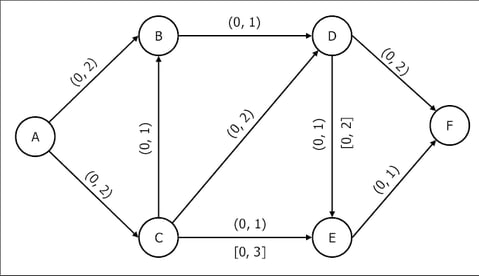
Example 6.12 Generalized Networks: Maximum Flow Problem
Consider the generalized network displayed in Output 6.12.1. Lower and upper bounds of the flow are displayed in parentheses above the arc, and cost and multiplier, where applicable, are indicated in square brackets below the arc.
Output 6.12.1
Generalized Maximum Flow Problem

You can enter the data for the problem using the following SAS code:
data garcsM;
   input _from_ $ _to_ $ _upper_ _mult_;
datalines;
A B 2 .
A C 2 .
C B 1 .
B D 1 .
C D 2 .
C E 1 3
D E 1 2
E F 5 .
D F 2 .
;
Use the following call to PROC NETFLOW:
title1 'The NETFLOW Procedure';
proc netflow
   arcdata = garcsM
   maxflow
   source  = A  sink = F
   conout  = gmfpout;
run;
The optimal solution is displayed in Output 6.12.2.
Output 6.12.2
Generalized Maximum Flow Problem: Optimal Solution
| The NETFLOW Procedure |
| Obs | _from_ | _to_ | _COST_ | _upper_ | _LO_ | _mult_ | _SUPPLY_ | _DEMAND_ | _FLOW_ | _FCOST_ |
|---|---|---|---|---|---|---|---|---|---|---|
| 1 | A | B | 0 | 2 | 0 | 1 | S | . | 1.00000 | 0 |
| 2 | C | B | 0 | 1 | 0 | 1 | . | . | 0.00000 | 0 |
| 3 | A | C | 0 | 2 | 0 | 1 | S | . | 2.00000 | 0 |
| 4 | B | D | 0 | 1 | 0 | 1 | . | . | 1.00000 | 0 |
| 5 | C | D | 0 | 2 | 0 | 1 | . | . | 1.00000 | 0 |
| 6 | C | E | 0 | 1 | 0 | 3 | . | . | 1.00000 | 0 |
| 7 | D | E | 0 | 1 | 0 | 2 | . | . | 1.00000 | 0 |
| 8 | E | F | 0 | 5 | 0 | 1 | . | D | 5.00000 | 0 |
| 9 | D | F | 0 | 2 | 0 | 1 | . | D | 1.00000 | 0 |