TEMPLATE Procedure: Creating Crosstabulation Table Templates

Example 1: Creating a Customized Crosstabulation Table Template with No Legend
| Features: |
crosstabs-attributes statements CELLVALUE statement
END statement FOOTER statement HEADER statement NOTES statement |
| Other features: |
|
Program
Proc Format;
   Value Govtfmt -3='Council Manager'
                  0='Commission'
                  3='Mayor Council'
                 .N='Not Applicable'
                  .='   ?';
   Value Robfmt   1='100 or  Less'
                  2='101-200'
                  3='201-300'
                  4='Over 300'
                 .N='Not     Known'
                  .='   ?';
   Value Colfg   1='yellow'
                  2='red'
                  3='blue'
                  4='purple'
                 .N='green'
                  .='black'
                  other='black';
   Value Rowfg   -3='red'
                  0='purple'
                  3='blue'
                 .N='green'
                  .='black'
                  other='black';

run;

data gov;
   Label Citygovt='City Government Form'
        Robgrp='Number of Meetings Scheduled';
   Input Citygovt Robgrp Weight;  Missing N;
   Format Citygovt Govtfmt. Robgrp Robfmt.;
   LOOP: OUTPUT; WEIGHT=WEIGHT-1; IF WEIGHT>0 THEN GOTO LOOP;
   DROP WEIGHT;
datalines;
0 1  6
0 3  3
0 2  7
0 4  5
N N 10
-3 1 47
-3 3 49
-3 2 63
-3 4 52
. 2  1
3 1 31
3 2 37
3 3 27
3 4 55
3 .  1
;
ods path (prepend) work.templat(update);
ods noproctitle;


proc template;
   define style white;
      parent=styles.htmlblue;
      style body /
         backgroundcolor=white;
      style systemtitle /
         backgroundcolor=white
         fontsize=6
         fontweight=bold
         fontstyle=italic;
      style systemfooter /
         backgroundcolor=white
         fontsize=2
         fontstyle=italic;
      style proctitle /
         backgroundcolor=white
         color=#6078bf
         fontweight=bold
         fontstyle=italic;
    end;
   define crosstabs Base.Freq.CrossTabFreqs;
      notes "Crosstabulation table";
      style=table {backgroundcolor=#BFCFFF};
      cell_style=data {backgroundcolor=#FFFFF0};
      row_var_style=rowheader {backgroundcolor=#BFCFFF  color=rowfg.};
      col_var_style=header {backgroundcolor=#BFCFFF  color=colfg.};
      row_total_style=data {backgroundcolor=#F0F0F0};
      col_total_style=data {backgroundcolor=#F0F0F0};
      grand_total_style=datastrong {backgroundcolor=#F0F0F0};
      legend_style=header {backgroundcolor=#BFCFFF color=#6078bf fontstyle=italic};
      rows_header=RowsHeader cols_header=ColsHeader;
      label = "Frequency Counts and Percentages";
      define header TableOf;
	        text "Table of " _ROW_LABEL_ " by " _COL_LABEL_ / _ROW_LABEL_ ^= ''
             & _COL_LABEL_ ^= '';
	        text "Table of " _ROW_LABEL_ " by " _COL_NAME_  / _ROW_LABEL_ ^= '';
	        text "Table of " _ROW_NAME_  " by " _COL_LABEL_ / _COL_LABEL_ ^= '';
	        text "Table of " _ROW_NAME_  " by " _COL_NAME_;
         style=header {backgroundcolor=#BFCFFF color=#6078bf fontstyle=italic};
         end;
      define header RowsHeader;
         text _ROW_LABEL_ / _ROW_LABEL_ ^= '';
         text _ROW_NAME_;
         style=header {backgroundcolor=#BFCFFF color=#6078bf fontstyle=italic};
         space=0;
         end;
      define header ColsHeader;
         text _COL_LABEL_ / _COL_LABEL_ ^= '';
         text _COL_NAME_;
         style=header {backgroundcolor=#BFCFFF color=#6078bf fontstyle=italic};
         space=1;
         end;
   define header ControllingFor;
      dynamic StratNum StrataVariableNames StrataVariableLabels;
      text "Controlling for" StrataVariableNames / StratNum > 0;
      style=header;
      end;
      define footer Missing;
         dynamic FMissing;
         text "Frequency Missing = " FMissing -12.99 / FMissing ^= 0;
         style=header {backgroundcolor=#BFCFFF color=#6078bf fontstyle=italic};
         space=1;
         end;

      define footer NoObs;
         dynamic SampleSize;
         text "Effective Sample Size = 0" / SampleSize = 0;
         space=1;
         style=header;
         end;
      define cellvalue Frequency;
         header="";
         label="Frequency Count";
         format=BEST7.; data_format_override=on; print=on;
         cellstyle _val_ < 10 as datastrong {color=green},
                   _val_ > 40 & _val_ < 50 as datastrong {color=orange},
                   _val_ >= 50 as datastrong {color=red};
         end;

      define cellvalue Expected;
         header="";
         label="Expected Frequency";
         format=BEST6. data_format_override=on print=on;
         end;

      define cellvalue Deviation;
         header="";
         label="Deviation from Expected Frequency";
         format=BEST6. data_format_override=on print=on;
         end;

      define cellvalue CellChiSquare;
         header="";
         label="Cell Chi-Square";
         format=BEST6. print=on;
         end;

      define cellvalue TotalPercent;
         header="";
         label="Percent of Total Frequency";
         format=6.2 print=on;
         end;

      define cellvalue Percent;
         header="";
         label="Percent of Two-Way Table Frequency";
         format=6.2 print=on;
         end;

      define cellvalue RowPercent;
         header="";
         label="Percent of Row Frequency";
         format=6.2 print=on;
         end;

      define cellvalue ColPercent;
         header="";
         label="Percent of Column Frequency";
         format=6.2 print=on;
         end;

      define cellvalue CumColPercent;
         header="";
         label="Cumulative Percent of Column Frequency";
         format=6.2 print=on;
         end;
      cellvalue
         Frequency Expected Deviation
         CellChiSquare TotalPercent Percent
         RowPercent ColPercent CumColPercent;
      header TableOf ControllingFor;
      footer NoObs Missing;
      end;
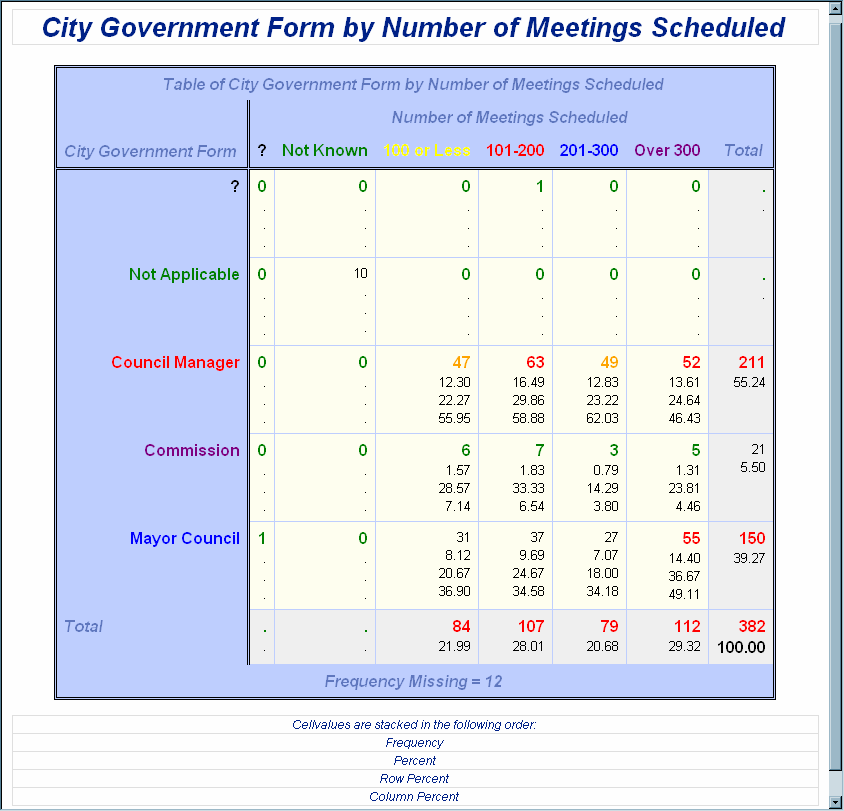
ods html file='MyCrosstabsTable.html' style=white;
title "City Government Form by Number of Meetings Scheduled";
footnote "Cellvalues are stacked in the following order:";
footnote2  "Frequency";
footnote3 "Percent";
footnote4 "Row Percent";
footnote5 "Column Percent";
ods noproctitle;
proc freq;
    tables citygovt*robgrp / missprint;
run;
ods html close;
Program Description
Create the user-defined formats and create the data set.The FORMAT procedure creates two user-defined formats
that can be used in the crosstabulation template. The DATA step creates
the Gov data set.
Proc Format;
   Value Govtfmt -3='Council Manager'
                  0='Commission'
                  3='Mayor Council'
                 .N='Not Applicable'
                  .='   ?';
   Value Robfmt   1='100 or  Less'
                  2='101-200'
                  3='201-300'
                  4='Over 300'
                 .N='Not     Known'
                  .='   ?';
   Value Colfg   1='yellow'
                  2='red'
                  3='blue'
                  4='purple'
                 .N='green'
                  .='black'
                  other='black';
   Value Rowfg   -3='red'
                  0='purple'
                  3='blue'
                 .N='green'
                  .='black'
                  other='black';

run;

data gov;
   Label Citygovt='City Government Form'
        Robgrp='Number of Meetings Scheduled';
   Input Citygovt Robgrp Weight;  Missing N;
   Format Citygovt Govtfmt. Robgrp Robfmt.;
   LOOP: OUTPUT; WEIGHT=WEIGHT-1; IF WEIGHT>0 THEN GOTO LOOP;
   DROP WEIGHT;
datalines;
0 1  6
0 3  3
0 2  7
0 4  5
N N 10
-3 1 47
-3 3 49
-3 2 63
-3 4 52
. 2  1
3 1 31
3 2 37
3 3 27
3 4 55
3 .  1
;
Establish the ODS path and create the White style.The ODS PATH statement specifies the locations to
write to or read from when creating the PROC TEMPLATE templates. The
PROC TEMPLATE statement, DEFINE STYLE statement, and collection of
STYLE statements create the style template White. The ODS NOPROCTITLE
statement suppresses the writing of the title of the FREQ procedure.
ods path (prepend) work.templat(update);
ods noproctitle;


proc template;
   define style white;
      parent=styles.htmlblue;
      style body /
         backgroundcolor=white;
      style systemtitle /
         backgroundcolor=white
         fontsize=6
         fontweight=bold
         fontstyle=italic;
      style systemfooter /
         backgroundcolor=white
         fontsize=2
         fontstyle=italic;
      style proctitle /
         backgroundcolor=white
         color=#6078bf
         fontweight=bold
         fontstyle=italic;
    end;
Create the crosstabulation template Base.Freq.CrossTabFreqs.The DEFINE statement creates the crosstabulation
template Base.Freq.CrossTabFreqs in the first template store in the
path for which you have Write access (Work, in this example). The
NOTES statement provides information about the crosstabulation table.
Change the appearance of individual table regions. The following DEFINE CROSSTABS statement attributes
modify the appearance of individual table regions. Each attribute
corresponds to a specific region of the table.
To see which attribute
corresponds to which table region, see Crosstabulation Table Regions and Corresponding Attributes.
      style=table {backgroundcolor=#BFCFFF};
      cell_style=data {backgroundcolor=#FFFFF0};
      row_var_style=rowheader {backgroundcolor=#BFCFFF  color=rowfg.};
      col_var_style=header {backgroundcolor=#BFCFFF  color=colfg.};
      row_total_style=data {backgroundcolor=#F0F0F0};
      col_total_style=data {backgroundcolor=#F0F0F0};
      grand_total_style=datastrong {backgroundcolor=#F0F0F0};
      legend_style=header {backgroundcolor=#BFCFFF color=#6078bf fontstyle=italic};
Specify a row header, a column header, and a label for
the table.The ROWS_HEADER= style attribute
specifies RowsHeader as the header for rows. The COLS_HEADER= style
attribute specifies ColsHeader as the header for columns. The LABEL=
attribute specifies a label for the crosstabulation template. The
label appears in the Results window.
Create the TableOf header template. The DEFINE HEADER statement and its attributes create
the header template TableOf, which is specified by the HEADER statement
later on in the program. The TEXT statement specifies the text of
the header by using dynamic variables that represent label variables
and names. The TEXT statements also use expressions to determine whether
row labels and column labels are assigned to the row and column variables.
Only TEXT statements that have true expressions are displayed in the
output. In this example, both the row label and the column label exist.
Therefore the first TEXT statement is used and the text resolves to:
"Table of City Government Form by Number of Meetings Scheduled". The
STYLE= attribute specifies style information for the header.
      define header TableOf;
	        text "Table of " _ROW_LABEL_ " by " _COL_LABEL_ / _ROW_LABEL_ ^= ''
             & _COL_LABEL_ ^= '';
	        text "Table of " _ROW_LABEL_ " by " _COL_NAME_  / _ROW_LABEL_ ^= '';
	        text "Table of " _ROW_NAME_  " by " _COL_LABEL_ / _COL_LABEL_ ^= '';
	        text "Table of " _ROW_NAME_  " by " _COL_NAME_;
         style=header {backgroundcolor=#BFCFFF color=#6078bf fontstyle=italic};
         end;
Create the RowsHeader header template. The DEFINE HEADER statement creates the header RowsHeader.
RowsHeader is specified as a row header by the preceding ROWS_HEADER=
style attribute. The TEXT statements specify the text of the header
by using dynamic variables that represent label variables and names.
The first TEXT statement uses an expression to determine whether a
label is assigned to the variable. If there is no label, the next
TEXT statement, which specifies the row name, will be used. In this
example there is a row label for the row variable, so in the output,
_ROW_LABEL_ resolves to “City Government Form”. The
STYLE= attribute specifies style information for the header, and the
SPACE attribute specifies that the current header and the previous
header should have one blank line between them.
      define header RowsHeader;
         text _ROW_LABEL_ / _ROW_LABEL_ ^= '';
         text _ROW_NAME_;
         style=header {backgroundcolor=#BFCFFF color=#6078bf fontstyle=italic};
         space=0;
         end;
Create the ColsHeader header template.The DEFINE HEADER statement creates the header ColsHeader.
ColsHeader is specified as a column header by the preceding COLS_HEADER=
style attribute. The TEXT statements specify the text of the header
by using dynamic variables that represent label variables and names.
The first TEXT statement uses an expression to determine whether a
label is assigned to the column variable. If there is no label, the
next TEXT statement, which specifies the row name, will be used. In
this example there is a column label, so in the output, _COL_LABEL_
resolves to “Number of Meetings Scheduled”. The STYLE=
attribute specifies style information for the header, and the SPACE
attribute specifies that the current header and the previous header
should have one blank line between them.
      define header ColsHeader;
         text _COL_LABEL_ / _COL_LABEL_ ^= '';
         text _COL_NAME_;
         style=header {backgroundcolor=#BFCFFF color=#6078bf fontstyle=italic};
         space=1;
         end;
Create the ControllingFor header template.The DEFINE HEADER statement and its attributes create
the header template ControllingFor. The DYNAMIC statement declares
dynamic variables so that they can be used in expressions. The TEXT
statement specifies the text of the header by using dynamic variables
that represent label variables and names. In this example, the expression
in the TEXT statement resolves to false, so the ControllingFor header
does not show up in the output. The STYLE= attribute specifies style
information for the headers.
   define header ControllingFor;
      dynamic StratNum StrataVariableNames StrataVariableLabels;
      text "Controlling for" StrataVariableNames / StratNum > 0;
      style=header;
      end;
Create footer templates. Each of these DEFINE FOOTER statements and its attributes creates
a footer template. For the footers to show up in the output, they
must be specified by the FOOTER statement. The DYNAMIC statements
declare the dynamic variables FMissing and SampleSize, so that they
can be used in the TEXT statements. The TEXT statements conditionally
select text to use as footers. In the first TEXT statement, the expression
is true, because FMissing is not 0. Therefore the first TEXT statement
is displayed in the output. In the second TEXT statement, the expression
resolves to false, so the NoObs footer does not appear in the output.
The STYLE attribute specifies style information for the footers, and
the SPACE attribute specifies that the current footer and the previous
footer should have one blank line between them.
      define footer Missing;
         dynamic FMissing;
         text "Frequency Missing = " FMissing -12.99 / FMissing ^= 0;
         style=header {backgroundcolor=#BFCFFF color=#6078bf fontstyle=italic};
         space=1;
         end;

      define footer NoObs;
         dynamic SampleSize;
         text "Effective Sample Size = 0" / SampleSize = 0;
         space=1;
         style=header;
         end;
Create the cellvalue definitions.The DEFINE CELLVALUE statements define the values
that will appear in the cells of the crosstabulation table. The HEADER=
attribute specifies the text that appears in the legend. Because there
is no text specified for any of these cellvalues, there is no legend
in the output. The FORMAT= attribute specifies the format to use for
the cellvalue. The DATA_FORMAT_OVERRIDE=ON attribute specifies to
use the format specified in the data component. The PRINT=ON attribute
specifies the cellvalue to appear in the table. The CELLSTYLE AS statement
uses expressions to set the style element of the cells conditionally
according to the values of the variables for the Frequency cellvalue.
The _VAL_ variable represents the value of a cell. Therefore, in this
example, if the value in a cell is less than ten, then the font color
for the DataStrong style element is green. If the value in the cell
is between 40 and 50, then the font color for the DataStrong style
element is orange. If the value is greater then 50, then the font
color is red.
      define cellvalue Frequency;
         header="";
         label="Frequency Count";
         format=BEST7.; data_format_override=on; print=on;
         cellstyle _val_ < 10 as datastrong {color=green},
                   _val_ > 40 & _val_ < 50 as datastrong {color=orange},
                   _val_ >= 50 as datastrong {color=red};
         end;

      define cellvalue Expected;
         header="";
         label="Expected Frequency";
         format=BEST6. data_format_override=on print=on;
         end;

      define cellvalue Deviation;
         header="";
         label="Deviation from Expected Frequency";
         format=BEST6. data_format_override=on print=on;
         end;

      define cellvalue CellChiSquare;
         header="";
         label="Cell Chi-Square";
         format=BEST6. print=on;
         end;

      define cellvalue TotalPercent;
         header="";
         label="Percent of Total Frequency";
         format=6.2 print=on;
         end;

      define cellvalue Percent;
         header="";
         label="Percent of Two-Way Table Frequency";
         format=6.2 print=on;
         end;

      define cellvalue RowPercent;
         header="";
         label="Percent of Row Frequency";
         format=6.2 print=on;
         end;

      define cellvalue ColPercent;
         header="";
         label="Percent of Column Frequency";
         format=6.2 print=on;
         end;

      define cellvalue CumColPercent;
         header="";
         label="Cumulative Percent of Column Frequency";
         format=6.2 print=on;
         end;
Specify which cellvalues appear in the table and the order
in which the cellvalues are stacked in the cells. The CELLVALUE statement specifies which cellvalues
appear in the output. In this example, all of the cellvalues that
were created appear in the table. The CELLVALUE statement also specifies
the order in which the cellvalues are stacked in the cells.
      cellvalue
         Frequency Expected Deviation
         CellChiSquare TotalPercent Percent
         RowPercent ColPercent CumColPercent;
Specify which headers and footers will appear in the output.The HEADER statement specifies which header templates
are applied to your output. The FOOTER statement specifies which footer
templates are applied to your output. In order for any of the headers
and footers defined by a DEFINE statement to appear in your output,
they must be specified by the FOOTER or HEADER statement.
Create the HTML output and specify the name of the HTML
file.The ODS HTML statement opens the
HTML destination and creates HTML output. The STYLE= option specifies
template White for the output style.
Specify a title and footnote, and suppress the printing
of the procedure title.The TITLE and
FOOTNOTE statements specify titles and footnotes for the output. The
ODS NOPROCTITLE statement prevents the printing of the FREQ procedure’s
title in the output.
title "City Government Form by Number of Meetings Scheduled";
footnote "Cellvalues are stacked in the following order:";
footnote2  "Frequency";
footnote3 "Percent";
footnote4 "Row Percent";
footnote5 "Column Percent";
ods noproctitle;
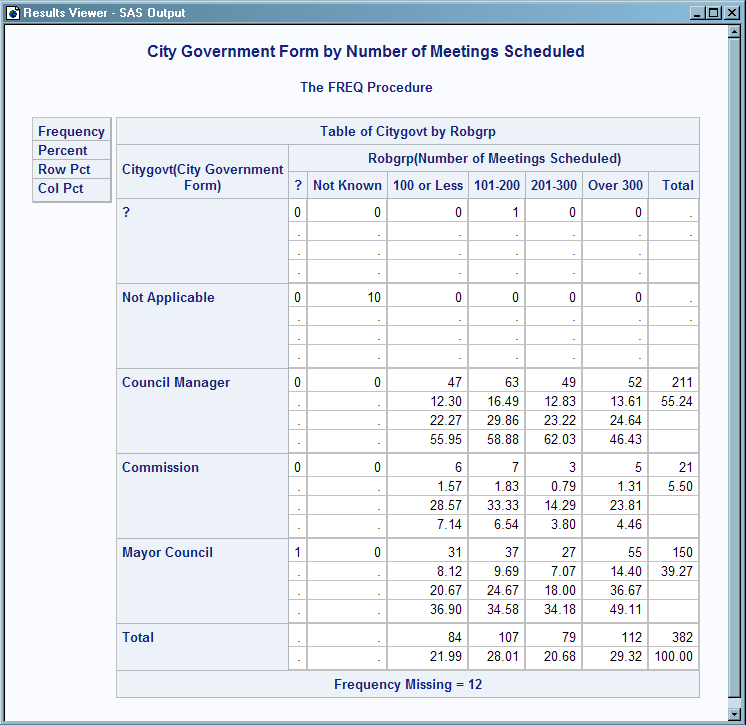
Create the crosstabulation table. The FREQ procedure creates a Citygovt by Robgrp
crosstabulation table.