Files Produced by the HTML Destination
Overview
The HTML destination can produce
four kinds of files: body, contents, frame, and page files. You create
these files with options in the ODS HTML statement (see ODS HTML Statement for details).
The Body File
The body file contains HTML output
that is generated from the output objects that your SAS job creates.
The style and the table template that the job uses determine the appearance
and content of the tables and the cells within them.
Typically, when you
route an output object that does not contain graphics to the HTML
destination, ODS places the results within
<TABLE> tags, generating them as one or more HTML tables.
Graphics output is produced
according to the SAS code that generates it. Instead of using
<TABLE> tags, the body file contains an <IMG> (image) tag that references the graphic.
When you view the body file in a browser, you cannot tell that the
graphic is not part of the body file because the <IMG> tag displays it in the browser.
Note: Very few procedures produce
output objects that are neither tabular nor graphics. In these cases,
the output is not tagged as an HTML table.
Titles and footnotes
in the body file are generated as HTML tables of their own near the
top and bottom of each page of HTML output.
Note: For graphics output, titles
and footnotes are, by default, part of the graphics file. You can
use the NOGTITLE and NOGFOOTNOTE options to place them in the body
file instead. See the discussion
of GTITLE and GFOOTNOTE in ODS HTML Statement for more information.
All
<TABLE> tags and all <IMG> tags are potential
targets for links or references (see How ODS Constructs Links and References). Therefore, ODS must provide an <A> tag with a NAME attribute
close to each <TABLE> and <IMG> tag for links and references to point to.
The NAME attribute on the anchor tag becomes
the final part of any reference or link to the table. ODS inserts
anchor tags in its HTML output as follows:
-
ODS places an anchor tag near the top of each page, before all tables on the page (including the table that holds the titles) and before all images. This anchor is the target for links to the first table (excluding any titles) or to the first image on the page.Note: Each procedure or DATA step starts a new page. In addition, ODS produces a new page of output whenever the SAS program explicitly asks for a new page. For example, if you use the page dimension in PROC TABULATE, then you create a page for each value of the variable that defines the pages. In this context, the word “page” has nothing to do with the PAGESIZE= setting in your SAS session.
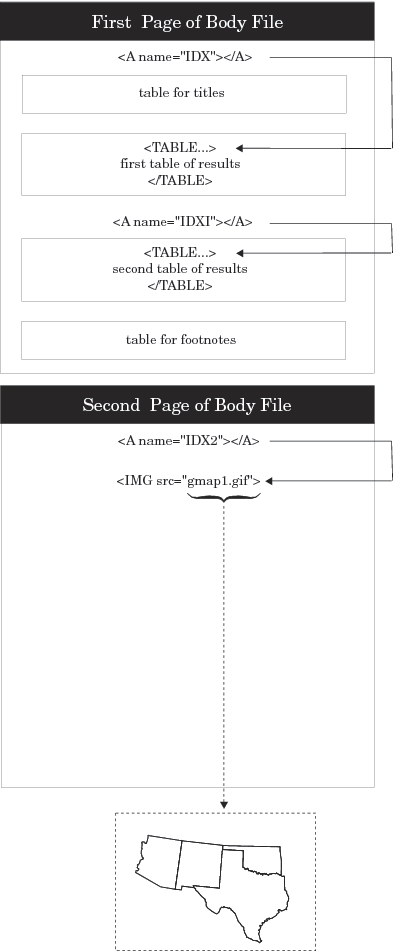
The following figure
illustrates the placement of anchor tags from a SAS job that executes
two procedures. The first procedure creates two HTML tables of results
on a single page. The page also includes an HTML table for the title
and one for the footnote. Solid arrows indicate which
<A> tag ODS uses as a target for each table.
The second procedure creates a GIF file. The titles for this procedure
are part of the GIF file (the default behavior). Again, the solid
arrow indicates which anchor tag ODS uses as a target when it creates
a link to the image. The dashed arrow points to the file that the <IMG> tag references.
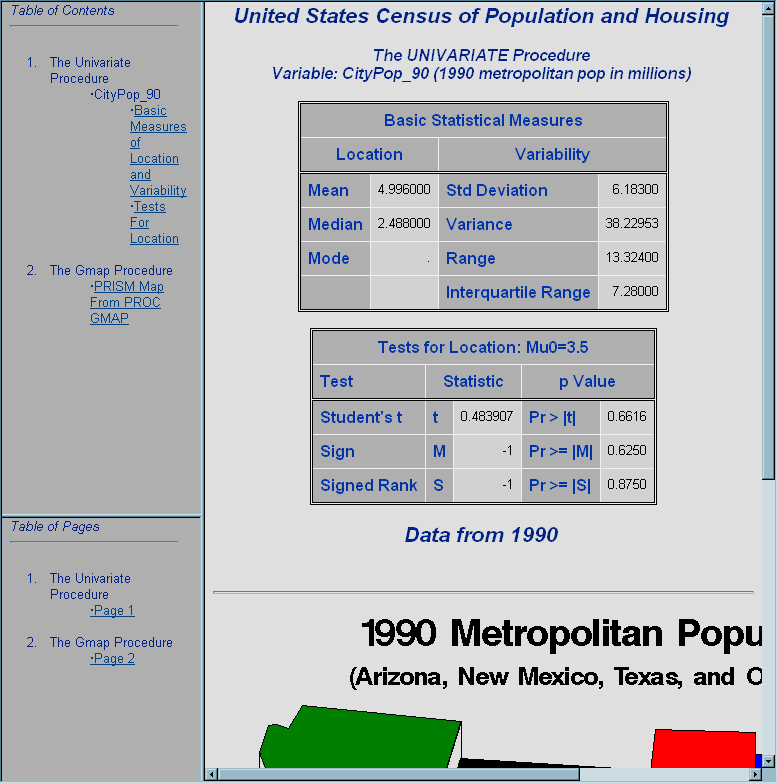
For a view of this same file through a browser, see Browser View of HTML Frame File.
The Contents File
The contents file contains a link to the
body file for each HTML table that ODS creates from procedure or DATA
step results. The targets for these links are the values of the
NAME attributes on the anchor tags that are in the body
file (see The Body File). For example, an anchor tag that links to the second HTML
table of results in Placement of <A> (anchor) Tags in HTML Output looks like this: <A href="pop-body.htm#IDX1">In this anchor tag,
You can view the contents
file directly in the browser, or, if you make a frame file, you can
see the contents file as part of the frame file (see The Frame File).
The Page File
The page file contains a link to the
body file for each page of HTML output that ODS creates from procedure
or DATA step results. The targets for these links are the values of
the
NAME attributes on the anchor tags that
are in the body file (see The Body File). For example, an anchor tag that links to the second page
of results in Placement of <A> (anchor) Tags in HTML Output looks like this: <A href="pop-body.htm#IDX2">In this anchor tag,
You can view the page
file directly in the browser, or, if you make a frame file, you can
see the page file as part of the frame file (see The Frame File).
The Frame File
The frame file provides a simultaneous
view of the body file and the contents file, the page file, or both.
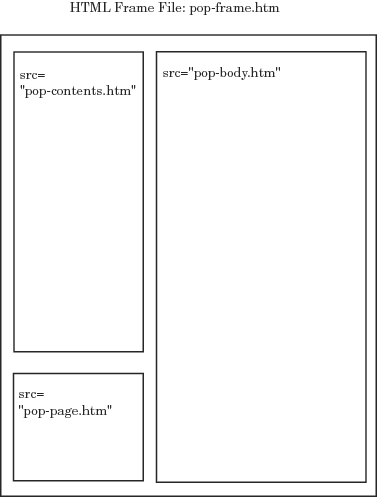
The following figure illustrates how a frame that references both
the contents and page files looks (in part) to an ASCII editor. The
SRC attribute identifies a file to display in the browser.
ODS constructs the value for the SRC attribute
the same way that it constructs the value for an HREF attribute in a page or contents file (see Schematic of an HTML Frame File).
Browser View of HTML Frame File shows the same frame file viewed from a browser.
options nodate pageno=1 linesize=80 pagesize=72;
data statepop;
  input State $ CityPop_80 CityPop_90 NonCityPop_80 NonCityPop_90 Region @@;
  label citypop_80=   '1980 metropolitan pop in millions'
        noncitypop_80='1980 nonmetropolitan pop in millions'
        citypop_90=   '1990 metropolitan pop in millions'
        noncitypop_90='1990 nonmetropolitan pop in million'
        region='Geographic region';
  datalines;
ME    .405    .443   .721   .785  1   NH   .535    .659   .386   .450  1
VT    .133    .152   .378   .411  1   MA  5.530   5.788   .207   .229  1
RI    .886    .938   .061   .065  1   CT  2.982   3.148   .126   .140  1
NY  16.144  16.515  1.414  1.475  1   NJ  7.365   7.730    .A     .A   1
PA  10.067  10.083  1.798  1.799  1   DE   .496    .553   .098   .113  2
MD   3.920   4.439   .297   .343  2   DC   .638    .607      .     .   2
VA   3.966   4.773  1.381  1.414  2   WV   .796    .748  1.155  1.045  2
NC   3.749   4.376  2.131  2.253  2   SC  2.114   2.423  1.006  1.064  2
GA   3.507   4.352  1.956  2.127  2   FL  9.039  12.023   .708   .915  2
KY   1.735   1.780  1.925  1.906  2   TN  3.045   3.298  1.546  1.579  2
AL   2.560   2.710  1.334  1.331  2   MS   .716    .776  1.805  1.798  2
AR    .963   1.040  1.323  1.311  2   LA  3.125   3.160  1.082  1.060  2
OK   1.724   1.870  1.301  1.276  2   TX 11.539  14.166  2.686  2.821  2
OH   8.791   8.826  2.007  2.021  3   IN  3.885   3.962  1.605  1.582  3
IL   9.461   9.574  1.967  1.857  3   MI  7.719   7.698  1.543  1.598  3
WI   3.176   3.331  1.530  1.561  3   MN  2.674   3.011  1.402  1.364  3
IA   1.198   1.200  1.716  1.577  3   MO  3.314   3.491  1.603  1.626  3
ND    .234    .257   .418   .381  3   SD   .194    .221   .497   .475  3
NE    .728    .787   .842   .791  3   KS  1.184   1.333  1.180  1.145  3
MT    .189    .191   .598   .608  4   ID   .257    .296   .687   .711  4
WY    .141    .134   .329   .319  4   CO  2.326   2.686   .563   .608  4
NM    .675    .842   .628   .673  4   AZ  2.264   3.106   .453   .559  4
UT   1.128   1.336   .333   .387  4   NV   .666   1.014   .135   .183  4
WA   3.366   4.036   .776   .830  4   OR  1.799   1.985   .834   .858  4
CA  22.907  28.799   .760   .961  4   AK   .174    .226   .227   .324  4
HI    .763    .836   .202   .272  4
;
run;

data statepop2 (drop=tempvar);
   length state 4;
   set statepop (rename=(state=tempvar));
   where tempvar in('AZ', 'NM', 'TX', 'OK');
   state=stfips(tempvar);
run;

ods html body='pop-body.htm'
     contents='pop-contents.htm'
         page='pop-page.htm'
        frame='pop-frame.htm'
         path='../ods'
              (url=none);
ods select basicmeasures testsforlocation;
proc univariate data=statepop2 mu0=3.5;
   var citypop_90;
title 'United States Census of Population and Housing';
footnote 'Data from 1990';
run;

ods listing close;
goptions reset=global gunit=pct cback=white
         colors=(black blue green red)
         ftext=swiss ftitle=swissb htitle=6 htext=4;
data states;
   set maps.us;
   where state in(04, 35, 40, 48);
run;
goptions target=gif transparency noborder;
title '1990 Metropolitan Population';
title2 f=swissb '(Arizona, New Mexico, Texas, and Oklahoma)';
proc gmap map=states data=statepop2;
   format citypop_90 comma9.;
   id state;
   prism citypop_90 / discrete;
run;
quit;
ods html close;
ods listing;