After the scoring task
successfully executes, you can use the graphics wizard to plot your
tailored charts.
To graph scoring task
results, follow these steps:
-
Select the scoring task
in the
Scoring node.
-
Select the
Graph tabbed view
of the scoring task and then click
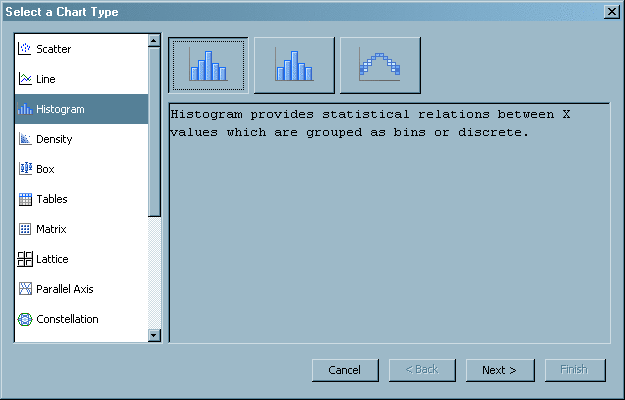
Graph Wizard. The
Select a Chart Type window appears.
-
Select a chart type
from list box on the left, and then select the chart display button
on the right. A description of how the results are graphed for a chart
appears.
-
Click
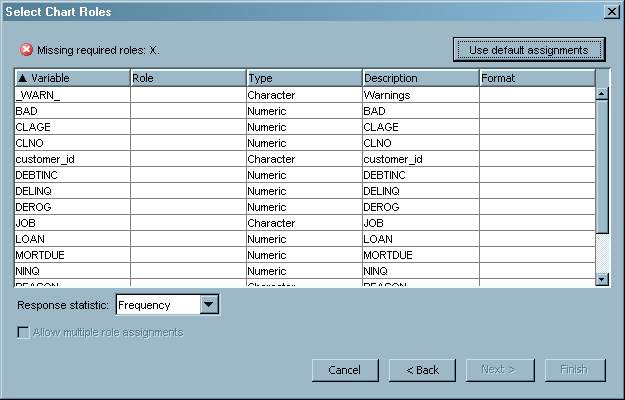
Next. The
Select Chart Roles window appears.
-
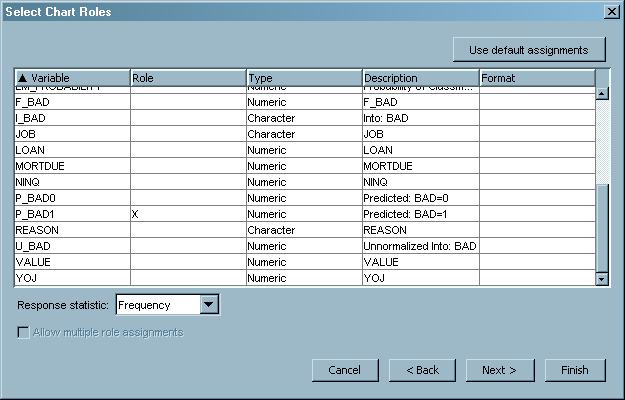
For each variable, select
the row and then select a value from the
Role list.
Note: You can also click
Use default assignments to assign variables to the required
roles.
-
-
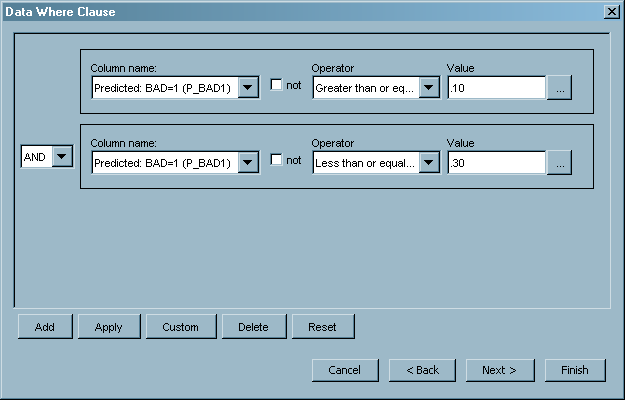
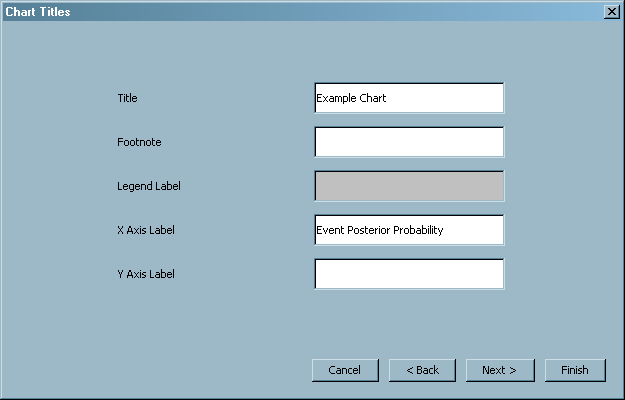
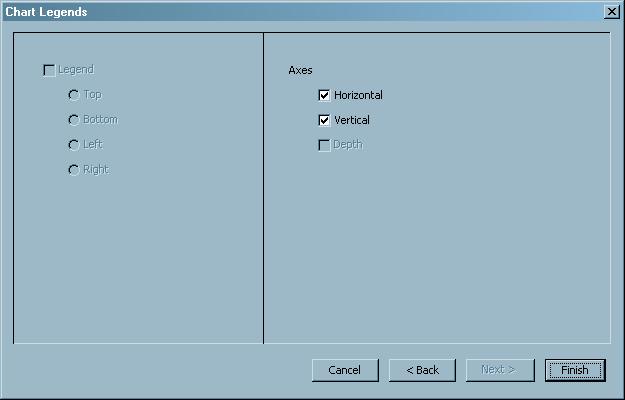
Follow the Graphics
Wizard to define the options such as data parameters, color, title,
legend, and so forth.
The following are examples
of the options that you can define:
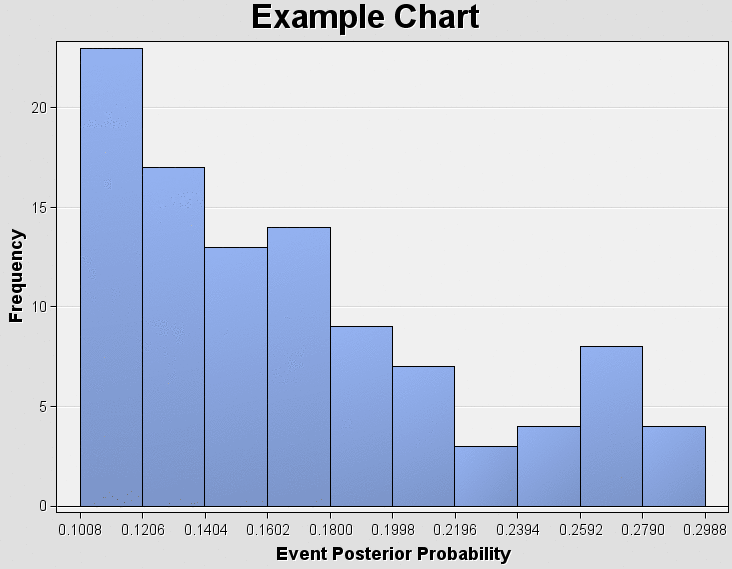
-
Click
Finish to display the graph.