Create Model Comparison and Summary Reports
In this exercise, you create several model comparison
reports that are used in the selection and approval of a champion
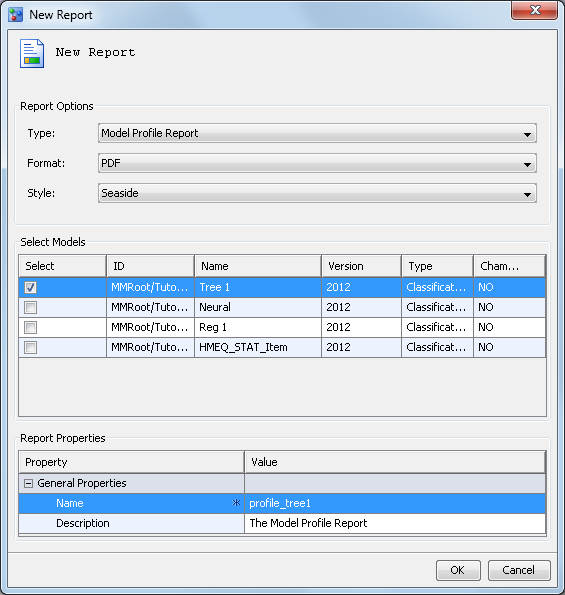
model. The Model Profile report can be created for any type of model.
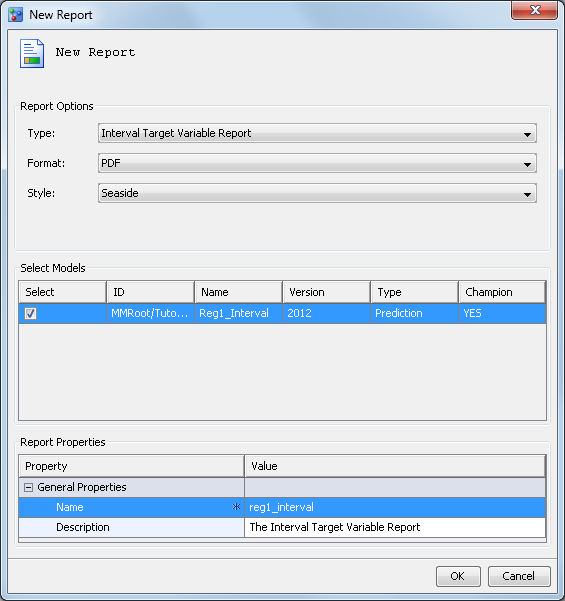
The Interval Target Variable report can be created only for a prediction
model. After you create the reports, you view them in the Reports folder.
The reports enable you to evaluate candidate models in a version or
across versions by assessing the structure, performance, and resilience
of your models.
Create a Model Profile Report
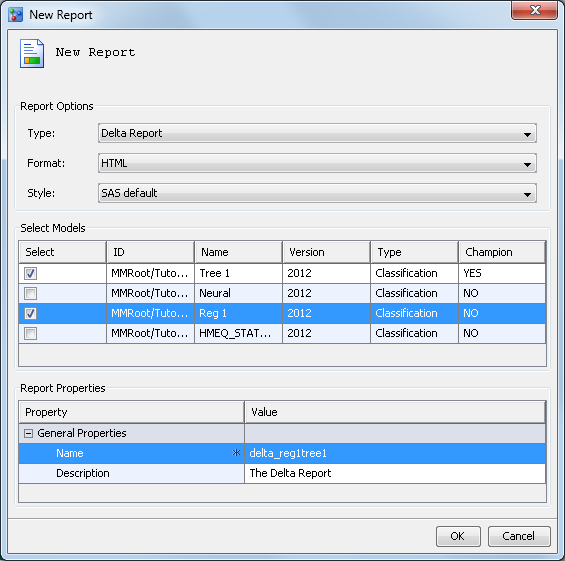
Create a Delta Report
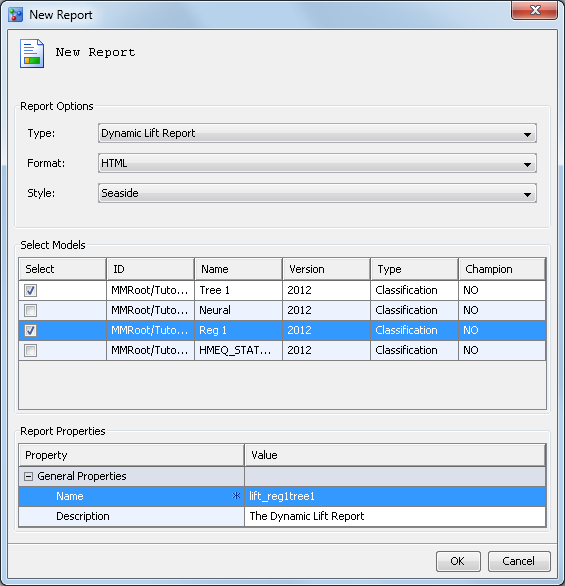
Create a Dynamic Lift Report
Create an Interval Target Variable Report
The Interval Target
Variable report creates two plots for you to view the actual versus
predicted values for a model and the actual versus residual values
for a model. This report can be created only for prediction models.
Note: This report is created based
on the sample data of the default test table. By default, the sample
size is 1000 and the sample seed is 12345. When the sample size is
less than or equal to 5000, the chart that is created in the report
is a scatter plot. When the sample size is greater than 5000, the
chart that is created in the report is a heat map. If you are using
your own data sets and want to create an Interval Target Variable
Report that contains a heat map, contact your SAS Administrator to
request that the Sample size for models with an interval
target configuration setting be changed to greater than
5000.
Training Summary Data Set Report (Optional)
About
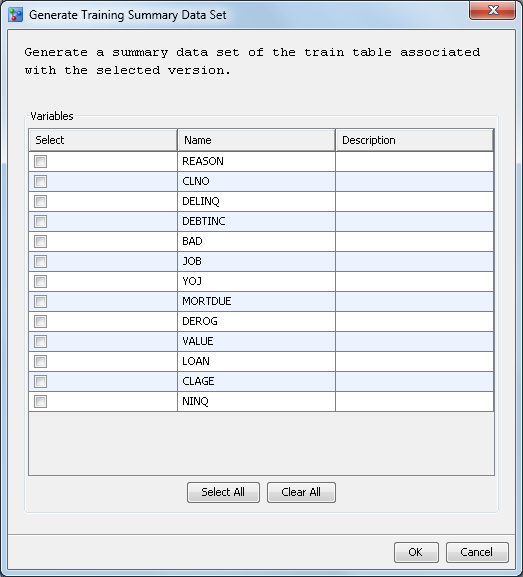
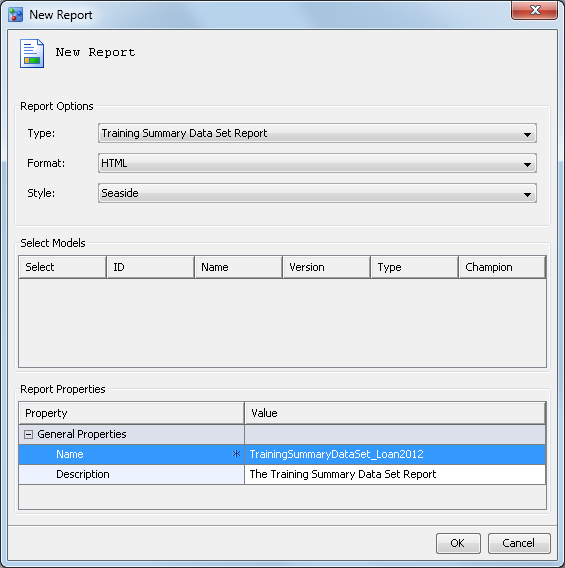
A Training Summary Data
Set report creates frequency and distribution charts that summarize
the train table variables. Using the default train table, SAS Model
Manager generates data sets in the Resources folder that contain numeric
and character variable summaries, and variable distributions. These
data sets are used to create the summary report. Before you can create
the report, you must generate the training summary data sets.
Update the Workflow Process (Optional)
-
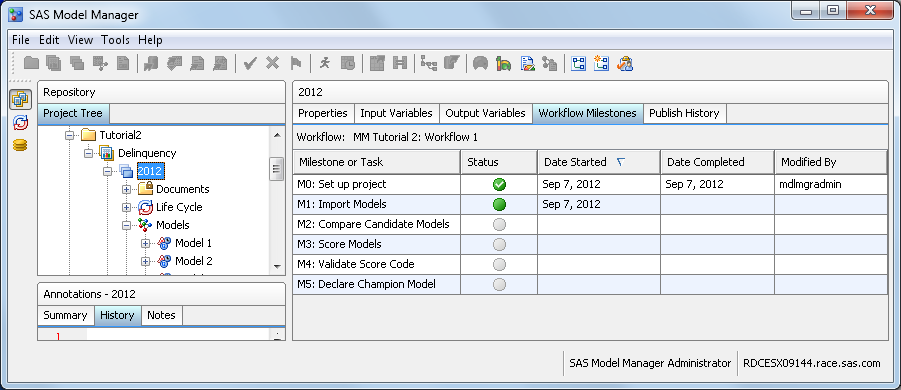
Note: A workflow can be configured to display the activities that are associated with a milestone or task on the Workflow Milestones tab and in the Workflow Milestones report for a version in the SAS Model Manager client application. From the Workflow Milestones tab you can view the status of milestones or tasks that are associated with activities in the workflow.
