Monitor the Performance of a Champion Model
In this tutorial you
use the Edit Performance Definition wizard to generate SAS code. You then execute the generated code.
To edit the performance
definition:
-
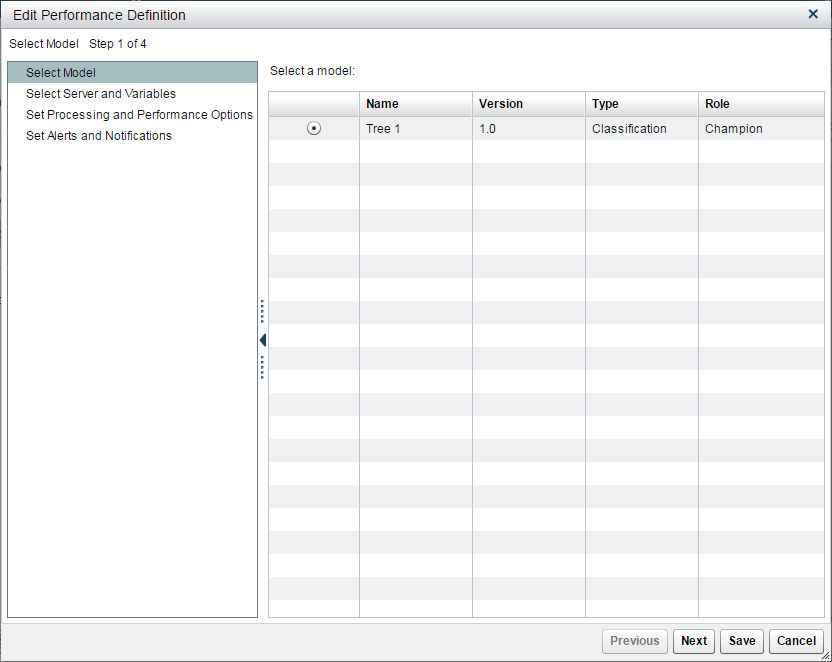
Select the Performance page.
-
-
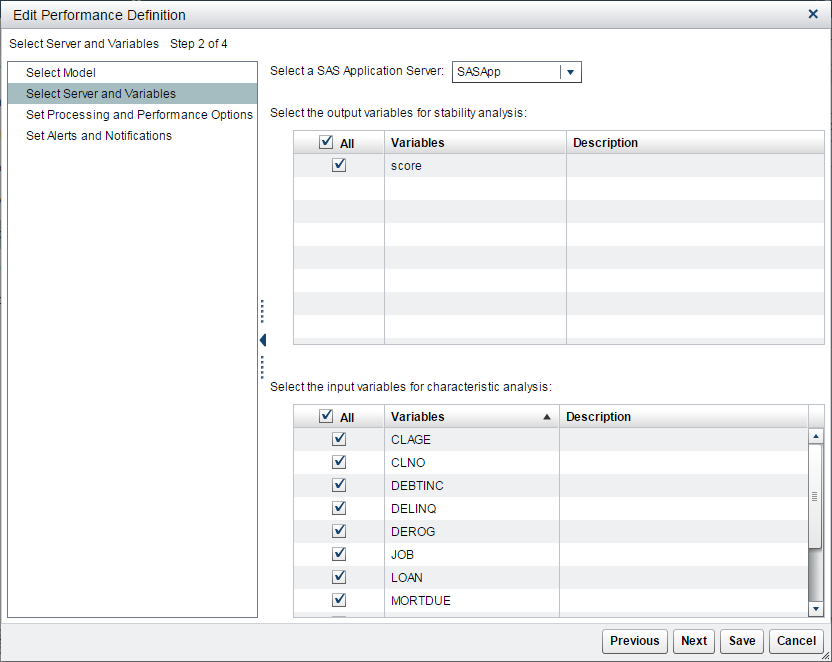
Select a SAS Application Server (for example, the default is SASApp).
-
-
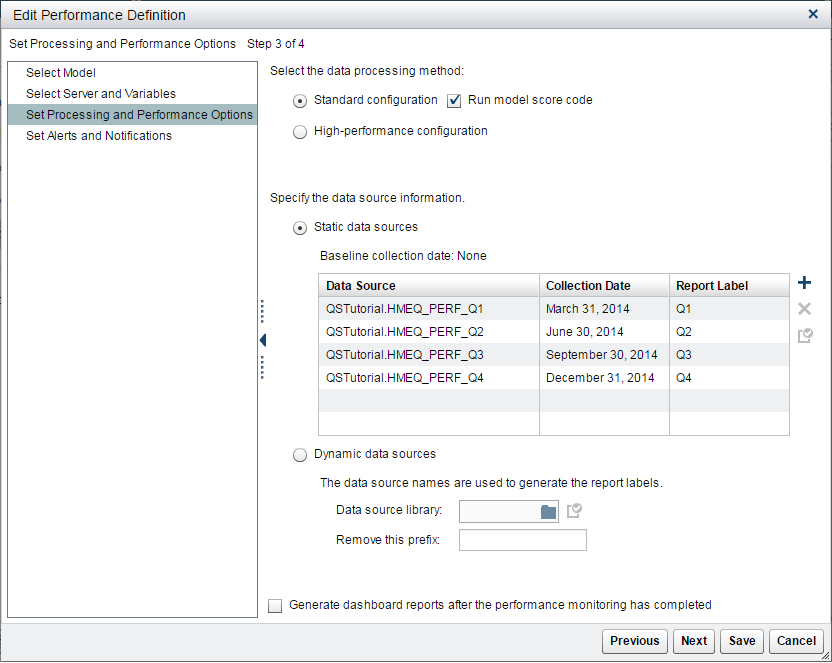
Select Standard configuration as the data processing method and select Run model score code to run the score code in the performance monitor job.
-
Specify the data source information.
-
Select Static data sources.
-
Click
 .
Note: The data table whose collection date is the earliest is set as the baseline performance data table.
.
Note: The data table whose collection date is the earliest is set as the baseline performance data table. -
Click the empty cell in the Data Source column.
-
Click Browse and select the HMEQ_PERF_Q1 performance data source from the QSTutorial library. Click OK.
-
Click the empty cell in the Collection Date column and click
 . Select the date of March 31, 2014. The date can be any date in the time period when the performance data was collected.
-
Enter the label Q1 in the Report Label column. The report label represents the time point of the performance data source. Because the report label appears in the performance charts, use a label that has not been used for another time period, is short, and is understandable.Note: If you duplicate report labels, the results in the previous performance results are overwritten.
-
(Optional) Select a data source and click
 to verify that the selected input variables and target variable are included in the performance data source.
-
(Optional) Repeat the above steps to add the following performance data sources from the QSTutorial library to the performance definition.Data SourceCollection DateReport LabelHMEQ_PERF_Q2June 30, 2014Q2HMEQ_PERF_Q3September 30, 2014Q3HMEQ_PERF_Q4December 31, 2014Q4
-
(Optional) To delete a data source from the performance definition, select the data source and click
 .
.
-
-
Click Next.Note: When prompted to replace the existing performance data, click Yes.
-
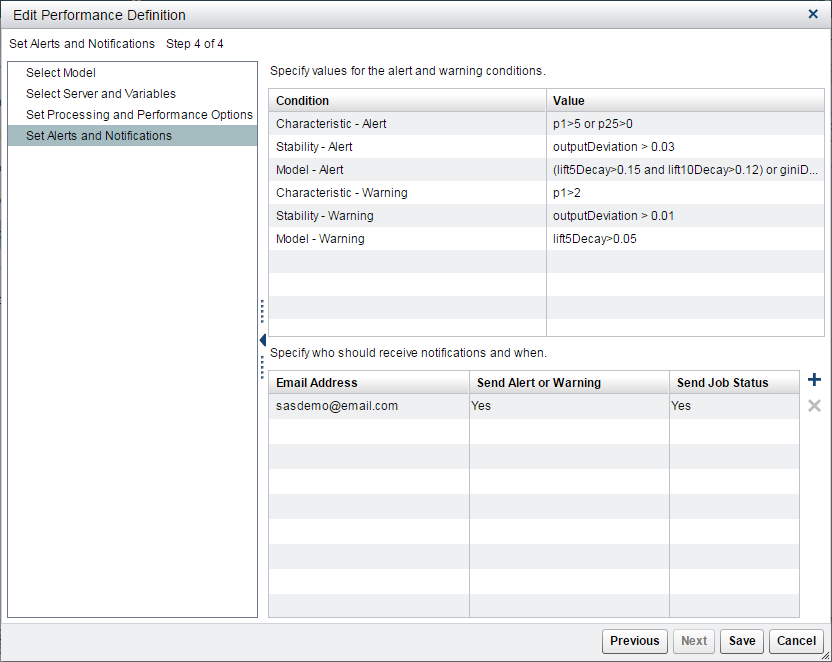
(Optional) Either specify values for the alert and warning conditions or accept the defaults. Click Next.
-
(Optional) To send the results by email, click. A new row is added to the table.
-
Enter an email address.
-
Select either Yes or No if you want an alert or warning to be sent by email when alert or warning thresholds have been exceeded.
-
Select either Yes or No if you want a completion notice with the job status to be sent by email every time the report runs.
-
-
Click Save.
-
Click
 .
.
-
-
Click the Results tab to view the performance results.Note: You can check the status of a job by clicking
 in the Job History tab.
A new record appears after the job has completed.
in the Job History tab.
A new record appears after the job has completed.

Copyright © SAS Institute Inc. All Rights Reserved.
Last updated: June 12, 2017