Statistical Graphics
You can use the HEATMAPCONT subroutine and the HEATMAPDISC subroutine to display a heat map that visualizes a matrix. The HEATMAPCONT subroutine displays a heat map of a numeric matrix whose values are assumed to vary continuously. The HEATMAPDISC subroutine displays a heat map of a numeric or character matrix whose values are assumed to have a small number of discrete values.
The following statements provide a simple example of creating a heat map that shows the relative ages, heights, and weights of 19 children. The SCALE="Col" option standardizes each column to have zero mean and unit standard deviation.
proc iml;
use Sashelp.Class;
read all var _NUM_ into Students[c=varNames r=Name];
close Sashelp.Class;

/* sort data in descending order according to Age and Height */
call sortndx(idx, Students, 1:2, 1:2);
Students = Students[idx,];
Name = Name[idx];

/* standardize each column */
call HeatmapCont(Students) scale="Col"
        xvalues=varNames yvalues=Name title="Student Data";
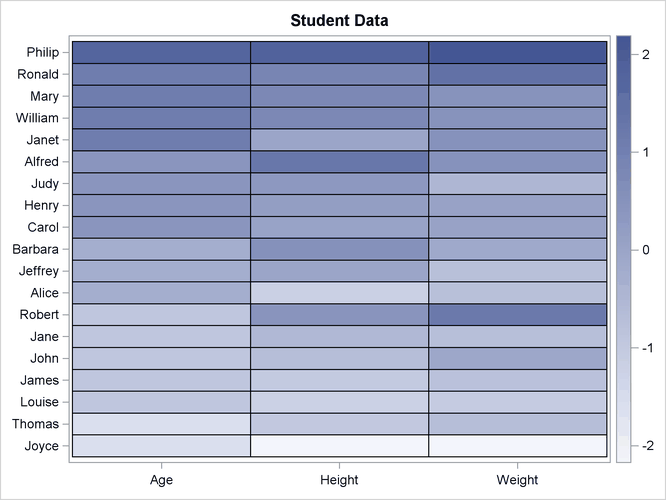
In Figure 15.12, you can see that Philip is the biggest student, Joyce is the smallest, Robert is heavy for his age, and Alfred is tall for his age.
You can also create a heat map of a matrix that contain discrete values. For example, the following statements compute the
correlation matrix for variables in the Sashelp.Cars data set. The correlations are then binned into five discrete categories:
use Sashelp.Cars;
read all var _NUM_ into Y[c=varNames];
close Sashelp.Cars;
corr = corr(Y);

/* You can visualize the correlations as a continous heat map:
      call HeatmapCont(corr) xvalues=varNames yvalues=varNames;
   Alternatively, bin the values into five categories, as follows: */
Bins = {"1: V. Neg", "2: Neg", "3: Neutral", "4: Pos", "5: V. Pos"};
idx = bin(corr, {-1, -0.6, -0.2, 0.2, 0.6, 1});
disCorr = shape(Bins[idx], nrow(corr));
call HeatmapDisc(disCorr) title="Correlations"
                 xvalues=varNames yvalues=varNames
                 LegendTitle="Magnitude";
The heat map shows strong negative correlations between fuel efficiency and three variables that indicate the size of a vehicle’s engine. There is almost no correlation between the size of a vehicle and the price of the vehicle. There are large positive correlations between the size of a vehicle and the size of its engine.