Wavelet Analysis

Fourier Transform Infrared (FT-IR) spectroscopy is an important tool in analytic chemistry. The following example demonstrates wavelet analysis applied to an FT-IR spectrum of quartz (Sullivan 2000). The following DATA step creates a data set that contains the spectrum, expressed as an absorbance value for each of 850 wave numbers.
data quartzInfraredSpectrum;
   WaveNumber=4000.6167786 - _N_ *4.00084378;
   input Absorbance @@;
datalines;
  4783  4426  4419  4652  4764  4764  4621  4475  4430  4618
  4735  4735  4655  4538  4431  4714  4738  4707  4627  4523
  4512  4708  4802  4811  4769  4506  4642  4799  4811  4732
  4583  4676  4856  4868  4796  4849  4829  4677  4962  4994
  4924  4673  4737  5078  5094  4987  4632  4636  5010  5166
  5166  4864  4547  4682  5161  5291  5143  4684  4662  5221
  5640  5640  5244  4791  4832  5629  5766  5723  5121  4690
  5513  6023  6023  5503  4675  5031  6071  6426  6426  5723
  5198  5943  6961  7135  6729  5828  6511  7500  7960  7960
  7299  6484  7257  8180  8542  8537  7154  7255  8262  8898
  8898  8263  7319  7638  8645  8991  8991  8292  7309  8005
  9024  9024  8565  7520  7858  8652  8966  8966  8323  7513
  8130  8744  8879  8516  7722  8099  8602  8729  8726  8238
  7885  8350  8600  8603  8487  7995  8194  8613  8613  8408
  7953  8236  8696  8696  8552  8102  7852  8570  8818  8818
  8339  7682  8535  9038  9038  8503  7669  7794  8864  9163
  9115  8221  7275  8012  9317  9317  8512  7295  7623  9021
  9409  9338  8116  6860  7873  9282  9490  9191  7012  7392
  9001  9483  9457  8107  6642  7695  9269  9532  9246  7641
  6547  8886  9457  9457  8089  6535  7537  9092  9406  9178
  7591  6470  7838  9156  9222  7974  6506  7360  8746  9057
  8877  7455  6504  7605  8698  8794  8439  7057  7202  8240
  8505  8392  7287  6634  7418  8186  8229  7944  6920  6829
  7499  7949  7831  7057  6866  7262  7626  7626  7403  6791
  7062  7289  7397  7397  7063  6985  7221  7221  7199  6977
  7088  7380  7380  7195  6957  6847  7426  7570  7508  6952
  6833  7489  7721  7718  7254  6855  7132  7914  8040  7880
  7198  6864  7575  8270  8229  7545  7036  7637  8470  8570
  8364  7591  7413  8195  8878  8878  8115  7681  8313  9102
  9185  8981  8283  8197  8932  9511  9511  9101  8510  8670
  9686  9709  9504  8944  8926  9504  9964  9964  9627  9212
  9366  9889 10100  9939  9540  9512  9860 10121 10121  9828
  9567  9513  9782  9890  9851  9510  9385  9339  9451  9451
  9181  9076  9015  8960  9014  8957  8760  8760  8602  8584
  8584  8459  8469  8373  8279  8327  8282  8341  8341  8155
  8260  8260  8250  8350  8245  8358  8403  8355  8490  8490
  8439  8689  8689  8621  8680  8661  8897  9028  8900  8873
  8873  9187  9377  9377  9078  9002  9147  9635  9687  9535
  9127  9242  9824  9928  9775  9200  9047  9572 10102 10102
  9631  9024  9209 10020 10271  9830  9062  9234 10154 10483
 10453  9582  9011  9713 10643 10701 10372  9368  9857 10865
 10936 10572  9574  9691 10820 11452 11452 10623  9903 10787
 11931 12094 11302 10604 11458 12608 12808 12589 11629 11795
 12863 13575 13575 12968 12498 13268 14469 14469 13971 13727
 14441 15334 15515 15410 14986 15458 16208 16722 16722 16618
 17061 17661 18089 18089 18184 18617 19015 19467 19633 19830
 20334 20655 20947 21347 21756 22350 22584 22736 22986 23412
 24126 24498 24501 24598 24986 25729 26356 26356 26271 26754
 27624 28162 28162 28028 28305 29223 30073 30219 30185 30308
 31831 32699 32819 32793 33320 34466 35600 36038 36086 36518
 37517 38765 39462 39681 40209 41243 42274 42772 42876 43172
 43929 44842 45351 45395 45551 46035 46774 47353 47353 47362
 47908 48539 48936 48978 49057 49497 50101 50670 50914 51134
 51603 52276 53007 53399 53769 54281 54815 54914 55365 55874
 56180 56272 56669 57076 57422 57458 57525 57681 57679 57318
 57318 57181 57417 57409 57144 57047 56377 56551 56483 56098
 56034 55598 55364 55364 55146 54904 54990 55501 55533 55362
 54387 55340 55240 54748 53710 55346 55795 55795 55060 55945
 55945 55753 56759 56859 57509 56741 56273 56961 58566 58566
 58104 59275 59275 59051 59090 59461 60362 60560 61103 61272
 61380 61878 62067 62237 62214 61182 61532 62173 62253 60473
 61346 63143 63378 61519 61753 63078 63841 63841 62115 61227
 63237 63237 61338 63951 63951 63604 63633 64625 65135 64976
 63630 63494 63834 63338 63218 62324 64131 64234 65122 64551
 64127 64415 64621 64621 63142 65344 65585 65476 65074 64714
 63803 65085 65085 65646 65646 64851 65390 65390 64997 65541
 65587 65682 65952 65952 65390 65702 65846 65734 65734 65628
 65509 65571 65636 65636 65620 65487 65544 65547 65738 65758
 65711 65360 65362 65362 65231 65333 65453 65473 65435 65302
 65412 65412 65351 65242 65242 65170 65221 65297 65297 65202
 65177 65183 65184 65179 65209 65209 65144 65134 65113 65009
 64919 64945 64988 64988 64856 64686 64529 64370 64282 64233
 64169 63869 63685 63480 63373 63349 63307 63131 63017 62885
 62736 62736 62706 62666 62622 62671 62781 62853 62950 63106
 63135 63141 63220 63263 63489 63807 63966 64132 64294 64612
 64841 64985 65159 65204 65259 65540 65707 65749 65732 65719
 65820 65895 65925 65925 65888 65937 66059 66109 66109 66078
 66007 65897 65897 65747 65490 64947 64598 64363 64140 63801
 63571 63395 63333 63442 63442 63339 63196 62911 62118 61795
 61454 61456 61607 62025 62190 62190 62023 61780 61502 61482
 61458 61320 61015 60852 60708 60684 60522 60488 60506 60640
 60797 60995 61141 61141 61036 60664 60522 60017 59681 59129
 58605 58035 57192 56137 54995 53586 52037 50283 48565 45419
 43341 41111 36131 35377 34431 31679 29237 26898 24655 22417
 19876 17244 15176 12575 10532  8180  6040  4059  2210   575
;
The following statements produce the line plot of these data displayed in Figure 19.1.
   symbol1 c=black i=join v=none;
   proc gplot data=quartzInfraredSpectrum;
      plot Absorbance*WaveNumber/
           hminor = 0   vminor = 0
           vaxis  = axis1
           hreverse frame;
           axis1 label = ( r=0 a=90 );
   run;
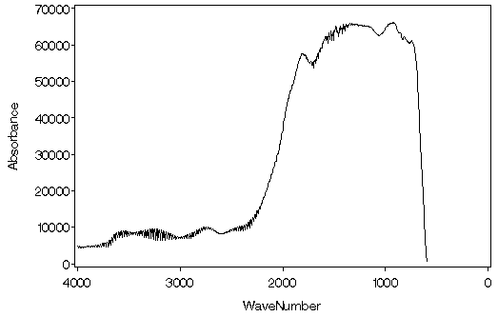
These data contain information at two distinct scales, namely a low-frequency curve superimposed with a high-frequency oscillation.
Notice that the oscillation is not uniform but occurs in several distinct bands. Wavelet analysis is an appropriate tool for
providing insight into this type of data, as it enables you to identify the frequencies present in the absorbance data as
the wave number changes. This property of wavelets is known as “time frequency localization”; in this case the role of time is played by WaveNumber. Also note that the dependent variable Absorbance is measured at equally spaced values of the independent variable WaveNumber. This condition is necessary for the direct use of the discrete wavelet transform that is implemented in the SAS/IML wavelet
functions.