Example 12.6 Hawkins-Bradu-Kass Data
The first 14 observations of the following data set (see Hawkins, Bradu, and Kass (1984)) are leverage points; however, only observations 12, 13, and 14 have large  , and only observations 12 and 14 have large
  values.
title "Hawkins, Bradu, Kass (1984) Data";
aa = { 1  10.1  19.6  28.3   9.7,
       2   9.5  20.5  28.9  10.1,
       3  10.7  20.2  31.0  10.3,
       4   9.9  21.5  31.7   9.5,
       5  10.3  21.1  31.1  10.0,
       6  10.8  20.4  29.2  10.0,
       7  10.5  20.9  29.1  10.8,
       8   9.9  19.6  28.8  10.3,
       9   9.7  20.7  31.0   9.6,
      10   9.3  19.7  30.3   9.9,
      11  11.0  24.0  35.0  -0.2,
      12  12.0  23.0  37.0  -0.4,
      13  12.0  26.0  34.0   0.7,
      14  11.0  34.0  34.0   0.1,
      15   3.4   2.9   2.1  -0.4,
      16   3.1   2.2   0.3   0.6,
      17   0.0   1.6   0.2  -0.2,
      18   2.3   1.6   2.0   0.0,
      19   0.8   2.9   1.6   0.1,
      20   3.1   3.4   2.2   0.4,
      21   2.6   2.2   1.9   0.9,
      22   0.4   3.2   1.9   0.3,
      23   2.0   2.3   0.8  -0.8,
      24   1.3   2.3   0.5   0.7,
      25   1.0   0.0   0.4  -0.3,
      26   0.9   3.3   2.5  -0.8,
      27   3.3   2.5   2.9  -0.7,
      28   1.8   0.8   2.0   0.3,
      29   1.2   0.9   0.8   0.3,
      30   1.2   0.7   3.4  -0.3,
      31   3.1   1.4   1.0   0.0,
      32   0.5   2.4   0.3  -0.4,
      33   1.5   3.1   1.5  -0.6,
      34   0.4   0.0   0.7  -0.7,
      35   3.1   2.4   3.0   0.3,
      36   1.1   2.2   2.7  -1.0,
      37   0.1   3.0   2.6  -0.6,
      38   1.5   1.2   0.2   0.9,
      39   2.1   0.0   1.2  -0.7,
      40   0.5   2.0   1.2  -0.5,
      41   3.4   1.6   2.9  -0.1,
      42   0.3   1.0   2.7  -0.7,
      43   0.1   3.3   0.9   0.6,
      44   1.8   0.5   3.2  -0.7,
      45   1.9   0.1   0.6  -0.5,
      46   1.8   0.5   3.0  -0.4,
      47   3.0   0.1   0.8  -0.9,
      48   3.1   1.6   3.0   0.1,
      49   3.1   2.5   1.9   0.9,
      50   2.1   2.8   2.9  -0.4,
      51   2.3   1.5   0.4   0.7,
      52   3.3   0.6   1.2  -0.5,
      53   0.3   0.4   3.3   0.7,
      54   1.1   3.0   0.3   0.7,
      55   0.5   2.4   0.9   0.0,
      56   1.8   3.2   0.9   0.1,
      57   1.8   0.7   0.7   0.7,
      58   2.4   3.4   1.5  -0.1,
      59   1.6   2.1   3.0  -0.3,
      60   0.3   1.5   3.3  -0.9,
      61   0.4   3.4   3.0  -0.3,
      62   0.9   0.1   0.3   0.6,
      63   1.1   2.7   0.2  -0.3,
      64   2.8   3.0   2.9  -0.5,
      65   2.0   0.7   2.7   0.6,
      66   0.2   1.8   0.8  -0.9,
      67   1.6   2.0   1.2  -0.7,
      68   0.1   0.0   1.1   0.6,
      69   2.0   0.6   0.3   0.2,
      70   1.0   2.2   2.9   0.7,
      71   2.2   2.5   2.3   0.2,
      72   0.6   2.0   1.5  -0.2,
      73   0.3   1.7   2.2   0.4,
      74   0.0   2.2   1.6  -0.9,
      75   0.3   0.4   2.6   0.2 };

a = aa[,2:4]; b = aa[,5];
The data are also listed in Rousseeuw and Leroy (1987).
The complete enumeration must inspect 1,215,450 subsets.
Output 12.6.1 displays the iteration history for MVE.
optn = j(9,1,.);
optn[1]= 3;              /* ipri */
optn[2]= 1;              /* pcov: print COV */
optn[3]= 1;              /* pcor: print CORR */
optn[5]= -1;             /* nrep: all subsets */

call mve(sc,xmve,dist,optn,a);
| Hawkins, Bradu, Kass (1984) Data |
| Subset | Singular | Best Criterion |
Percent |
|---|---|---|---|
| 121545 | 0 | 51.104276 | 10 |
| 243090 | 1 | 51.104276 | 20 |
| 364635 | 1 | 51.104276 | 30 |
| 486180 | 2 | 51.104276 | 40 |
| 607725 | 3 | 51.104276 | 50 |
| 729270 | 9 | 6.271725 | 60 |
| 850815 | 35 | 6.271725 | 70 |
| 972360 | 55 | 5.912308 | 80 |
| 1093905 | 76 | 5.912308 | 90 |
| 1215450 | 114 | 5.912308 | 100 |
Output 12.6.2 reports the robust parameter estimates for MVE.
| Robust MVE Location Estimates | |
|---|---|
| VAR1 | 1.5133333333 |
| VAR2 | 1.8083333333 |
| VAR3 | 1.7016666667 |
| Robust MVE Scatter Matrix | |||
|---|---|---|---|
| VAR1 | VAR2 | VAR3 | |
| VAR1 | 1.1143954802 | 0.0939548023 | 0.1416723164 |
| VAR2 | 0.0939548023 | 1.1231497175 | 0.1174435028 |
| VAR3 | 0.1416723164 | 0.1174435028 | 1.0747429379 |
Output 12.6.3 reports the eigenvalues of the robust scatter matrix and the robust correlation matrix.
| Eigenvalues of Robust Scatter Matrix |
|
|---|---|
| VAR1 | 1.3396371545 |
| VAR2 | 1.0281247572 |
| VAR3 | 0.9445262239 |
| Robust Correlation Matrix | |||
|---|---|---|---|
| VAR1 | VAR2 | VAR3 | |
| VAR1 | 1 | 0.0839808925 | 0.1294532696 |
| VAR2 | 0.0839808925 | 1 | 0.1068951177 |
| VAR3 | 0.1294532696 | 0.1068951177 | 1 |
Output 12.6.4 shows a portion of the classical Mahalanobis and robust distances obtained by complete enumeration. The first 14 observations are recognized as outliers (leverage points).
| Classical Distances and Robust (Rousseeuw) Distances | |||
|---|---|---|---|
| Unsquared Mahalanobis Distance and | |||
| Unsquared Rousseeuw Distance of Each Observation | |||
| N | Mahalanobis Distances | Robust Distances | Weight |
| 1 | 1.916821 | 29.541649 | 0 |
| 2 | 1.855757 | 30.344481 | 0 |
| 3 | 2.313658 | 31.985694 | 0 |
| 4 | 2.229655 | 33.011768 | 0 |
| 5 | 2.100114 | 32.404938 | 0 |
| 6 | 2.146169 | 30.683153 | 0 |
| 7 | 2.010511 | 30.794838 | 0 |
| 8 | 1.919277 | 29.905756 | 0 |
| 9 | 2.221249 | 32.092048 | 0 |
| 10 | 2.333543 | 31.072200 | 0 |
| 11 | 2.446542 | 36.808021 | 0 |
| 12 | 3.108335 | 38.071382 | 0 |
| 13 | 2.662380 | 37.094539 | 0 |
| 14 | 6.381624 | 41.472255 | 0 |
| 15 | 1.815487 | 1.994672 | 1.000000 |
| 16 | 2.151357 | 2.202278 | 1.000000 |
| 17 | 1.384915 | 1.918208 | 1.000000 |
| 18 | 0.848155 | 0.819163 | 1.000000 |
| 19 | 1.148941 | 1.288387 | 1.000000 |
| 20 | 1.591431 | 2.046703 | 1.000000 |
| 21 | 1.089981 | 1.068327 | 1.000000 |
| 22 | 1.548776 | 1.768905 | 1.000000 |
| 23 | 1.085421 | 1.166951 | 1.000000 |
| 24 | 0.971195 | 1.304648 | 1.000000 |
| 25 | 0.799268 | 2.030417 | 1.000000 |
| 26 | 1.168373 | 1.727131 | 1.000000 |
| 27 | 1.449625 | 1.983831 | 1.000000 |
| 28 | 0.867789 | 1.073856 | 1.000000 |
| 29 | 0.576399 | 1.168060 | 1.000000 |
| 30 | 1.568868 | 2.091386 | 1.000000 |
| ... | ... | ... | ... |
| 75 | 1.899178 | 2.042560 | 1.000000 |
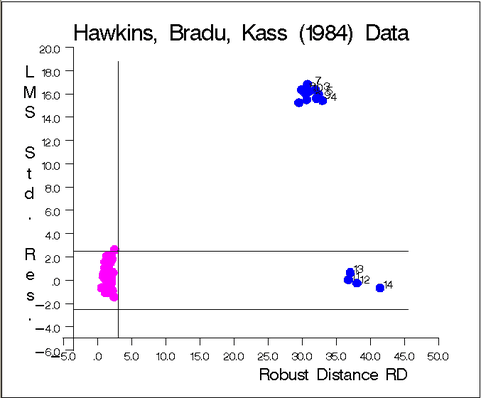
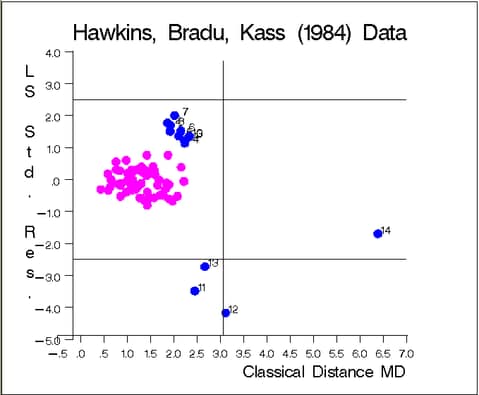
The graphs in Figure 12.6.5 and Figure 12.6.6 show the following:
the plot of standardized LMS residuals vs. robust distances

the plot of standardized LS residuals vs. Mahalanobis distances

The graph identifies the four good leverage points 11, 12, 13, and 14, which have small standardized LMS residuals but large robust distances, and the 10 bad leverage points  , which have large standardized LMS residuals and large robust distances.

