| Wavelet Analysis |
Reconstructing the Signal from the Wavelet Decomposition
You can use the WAVIFT subroutine to invert a wavelet transformation computed with the WAVFT subroutine. If no thresholding is specified, then up to numerical rounding error this inversion is exact. The following statements provide an illustration of this:
       call wavift(reconstructedAbsorbance,decomp);
       errorSS=ssq(absorbance-reconstructedAbsorbance);
       print "The reconstruction error sum of squares = " errorSS;
The output is shown in Figure 16.15.
|
Figure 16.15: Exact Reconstruction Property of WAVIFT
Usually you use the WAVIFT subroutine with thresholding specified. This yields a smoothed reconstruction of the input data. You can use the following statements to create a smoothed reconstruction of absorbance and add this variable to the QuartzInfraredSpectrum data set.
       call wavift(smoothedAbsorbance,decomp,&SureShrink);
       create temp from smoothedAbsorbance[colname='smoothedAbsorbance'];
          append from smoothedAbsorbance;
       close temp;
    quit;

    data quartzInfraredSpectrum;
      set quartzInfraredSpectrum;
      set temp;
    run;
The following statements produce the line plot of the smoothed absorbance data shown in Figure 16.16:
    symbol1 c=black i=join v=none;
    proc gplot data=quartzInfraredSpectrum;
       plot smoothedAbsorbance*WaveNumber/
            hminor = 0   vminor = 0
            vaxis  = axis1
            hreverse frame;
            axis1 label = ( r=0 a=90 );
    run;
|
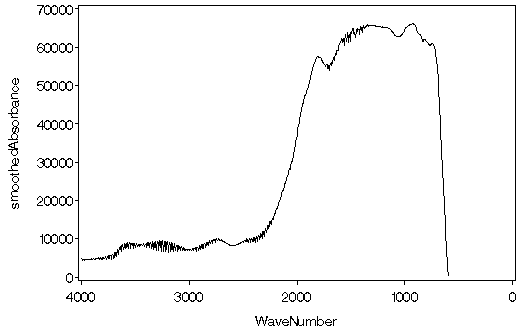
Figure 16.16: Smoothed FT-IR Spectrum of Quartz
You can see by comparing Figure 16.1 with Figure 16.16 that the wavelet smooth of the absorbance data has preserved all the essential features of these data.
Copyright © 2009 by SAS Institute Inc., Cary, NC, USA. All rights reserved.