| Robust Regression Examples |
Flow Chart for LMS, LTS, MCD, and MVE
Figure 9.1 illustrates the logic for the LMS, LTS, MCD, and MVE subroutines.
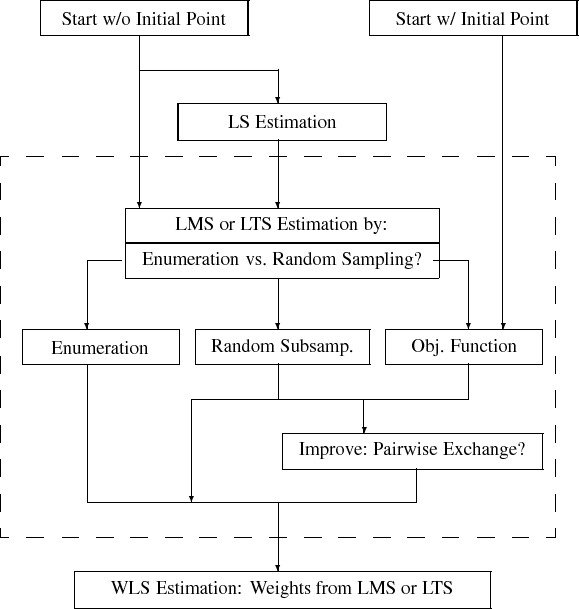
Flow Chart Indicating: LS  LMS or LTS
 ![] \longrightarrow](images/robustregexpls_robustregexplseq29.gif) WLS
WLS
Separate LMS or LTS Part Inside Dashbox Corresponds to MCD, MVE
Figure 9.1: Flow Chart for LMS, LTS, MCD, and MVE
Copyright © 2009 by SAS Institute Inc., Cary, NC, USA. All rights reserved.