| Language Reference |
RANDGEN Call
generates random numbers from a specified distribution
- CALL RANDGEN( result, distname<, parm1><, parm2><, parm3>);
- result
- is a matrix that is to be filled with random samples from the specified distribution.
- distname
- is the name of the distribution that is to be sampled.
- parm1
- is a distribution shape parameter.
- parm2
- is a distribution shape parameter.
- parm3
- is a distribution shape parameter.
The RANDGEN call generates random numbers by using the same numerical method as the RAND function in base SAS, with the efficiency optimized for IML. You can initialize the random number stream used by RANDGEN with the RANDSEED call. The
The following distributions can be sampled.
Bernoulli Distribution
The random sample
Beta Distribution
The random sampleBinomial Distribution
The random sample
Cauchy Distribution
The random sampleChi-Square Distribution
The random sample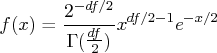
Erlang Distribution
The random sampleExponential Distribution
The random sampleF Distribution ( )
)
The random sample 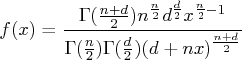
Gamma Distribution
The random sampleGeometric Distribution
The random sampleHypergeometric Distribution
The random sample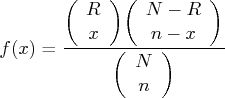
Lognormal Distribution
The random sampleNegative Binomial Distribution
The random sample
Normal Distribution
The random samplePoisson Distribution
The random sampleT Distribution
The random sample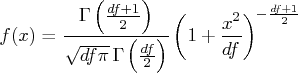
Table Distribution
The random samplewhere

Triangle Distribution
The random sample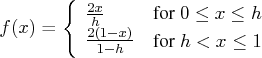
Uniform Distribution
The random sampleWeibull Distribution
The random sample![]() is in the range:
is in the range: ![]()
![]() and
and ![]() are shape parameters, with range
are shape parameters, with range ![]() and
and ![]()
The following table describes how parameters of the RANDGEN call correspond to the distribution parameters.
Table 20.2: Parameter Assignments for Distributions| Distribution | distname | parm1 | parm2 | parm3 |
| Bernoulli | 'BERNOULLI' | |||
| Beta | 'BETA' | |||
| Binomial | 'BINOMIAL' | |||
| Cauchy | 'CAUCHY' | |||
| Chi-Square | 'CHISQUARE' | |||
| Erlang | 'ERLANG' | |||
| Exponential | 'EXPONENTIAL' | |||
| 'F' | ||||
| Gamma | 'GAMMA' | |||
| Geometric | 'GEOMETRIC' | |||
| Hypergeometric | 'HYPERGEOMETRIC' | |||
| Lognormal | 'LOGNORMAL' | |||
| Negative Binomial | 'NEGBINOMIAL' | |||
| Normal | 'NORMAL' | |||
| Poisson | 'POISSON' | |||
| T | 'T' | |||
| Table | 'TABLE' | |||
| Triangle | 'TRIANGLE' | |||
| Uniform | 'UNIFORM' | |||
| Weibull | 'WEIBULL' |
In practice, distname can be in lowercase or uppercase, and you only need to specify enough letters to distinguish one distribution from the others. For example,
 /* generate 10 samples from a Bernoulli distribution */
 r = j(10,1,.);
 call randgen(r,'ber',p);
Except for the normal distribution, you must specify the parameters listed
for each of the preceding distributions or IML will report an error. For the normal
distribution, default values of ![]() and
and ![]() are used
if none are supplied.
are used
if none are supplied.
The following example illustrates the use of the RANDGEN call.
 call randseed(12345);

 /* get four random observations from each distribution */
 x = j(1,4,.);
 /* each row of m comes from a different distribution */
 m = j(20,4,.);
 call randgen(x,'BERN',0.75);
 m[1,] = x;
 call randgen(x,'BETA',3,0.1);
 m[2,] = x;
 call randgen(x,'BINOM',10,0.75);
 m[3,] = x;
 call randgen(x,'CAUCHY');
 m[4,] = x;
 call randgen(x,'CHISQ',22);
 m[5,] = x;
 call randgen(x,'ERLANG', 7);
 m[6,] = x;
 call randgen(x,'EXPO');
 m[7,] = x;
 call randgen(x,'F',12,322);
 m[8,] = x;
 call randgen(x,'GAMMA',7.25);
 m[9,] = x;
 call randgen(x,'GEOM',0.02);
 m[10,] = x;
 call randgen(x,'HYPER',10,3,5);
 m[11,] = x;
 call randgen(x,'LOGN');
 m[12,] = x;
 call randgen(x,'NEGB',0.8,5);
 m[13,] = x;
 call randgen(x,'NORMAL'); /* default parameters */
 m[14,] = x;
 call randgen(x,'POISSON',6.1);
 m[15,] = x;
 call randgen(x,'T',4);
 m[16,] = x;
 p = {0.1 0.2 0.25 0.1 0.15 0.1 0.1};
 call randgen(x,'TABLE',p);
 m[17,] = x;
 call randgen(x,'TRIANGLE',0.7);
 m[18,] = x;
 call randgen(x,'UNIFORM');
 m[19,] = x;
 call randgen(x,'WEIB',0.25,2.1);
 m[20,] = x;
 print m;
The output is as follows:
                        M

              1         0         1         0
              1 0.9999234 0.9842784 0.9997739
              7         8         5        10
      -1.209834 3.9732282 -0.048339 -1.337284
      30.300691 20.653151 27.301922 26.878221
      10.636299 4.6455449 7.5284821 2.5558646
      0.2449632 2.7656037 4.2254588 0.2866158
      0.7035829 1.2676112 0.9806787 1.4811389
       8.475216 8.8723256 8.2993617 8.0409742
            109         4        33        30
              1         1         2         1
      0.7784513 0.9792472 0.6018993 0.3643607
              3         2         0         2
      0.0053637 1.4026784 -0.271338 -0.416685
              5        11         8         4
      1.3237918 0.0505162 -0.660845 -0.634447
              2         3         2         3
      0.5270875 0.6909336 0.8607548 0.5450831
      0.4064393 0.7464901 0.3463207 0.2615394
      0.4183405 0.9981923 16.812803 0.0001131
Copyright © 2009 by SAS Institute Inc., Cary, NC, USA. All rights reserved.