Multivariate Analysis: Discriminant Analysis
Tables Tab
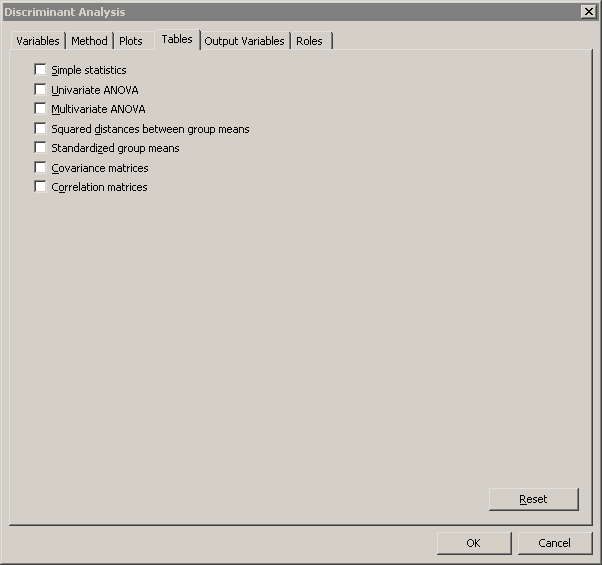
The Tables tab is shown in Figure 30.7. You can use the Tables tab to display the following tables that summarize the results of the analysis. For more information, see the "Displayed Output" subsection of the "Details" section in the documentation for the DISCRIM procedure.
- Simple statistics
-
specifies whether to display descriptive statistics for the total sample and within each group. This option corresponds to the SIMPLE option in the PROC DISCRIM statement. - Univariate ANOVA
-
specifies whether to display univariate statistics for testing the hypothesis that the population group means are equal for each variable. This option corresponds to the ANOVA option in the PROC DISCRIM statement. - Multivariate ANOVA
-
specifies whether to display multivariate statistics for testing the hypothesis that the population group means are equal for each variable. This option corresponds to the MANOVA option in the PROC DISCRIM statement. - Squared distances between group means
-
specifies whether to display the squared Mahalanobis distances (and associated statistics) between the group means. This option corresponds to the DISTANCE option in the PROC DISCRIM statement. - Standardized group means
-
specifies whether to display total-sample and pooled within-group standardized group means. This option corresponds to the STDMEAN option in the PROC DISCRIM statement. - Covariance matrices
-
specifies whether to display the correlation matrices for each set of variables. This option corresponds to the BCOV, PCOV, TCOV, and WCOV options in the PROC DISCRIM statement. - Correlation matrices
-
specifies whether to display the correlation matrices for each set of variables. This option corresponds to the BCORR, PCORR, TCORR, and WCORR options in the PROC DISCRIM statement.
Figure 30.7: The Tables Tab
In addition to the previous optional tables, the Discriminant analysis always creates the following tables. The name of the table refers to the ODS table name.
- Counts
-
corresponds to the "Counts" table. - Class level information
-
corresponds to the "Levels" table. - Linear discriminant function
-
corresponds to the "LinearDiscFunc" table. This table is displayed only for the linear parametric classification method. - Number of observations and percent classified
-
corresponds to the "ClassifiedResub" or "ClassifiedCrossVal" table. - Error count estimates
-
corresponds to the "ErrorResub" or "ErrorCrossVal" table.