You can change the markers used to represent observations. You can use marker shapes and colors to represent observations that share common properties.
Marker shapes are often used to discriminate observations with different values of a categorical variable (for example, male versus female). Marker colors can also be used for this purpose, or they can represent a continuous variable. Chapter 9: General Plot Properties, describes coloring markers by a continuous variable.
Select → → from the main menu to open the Marker Properties dialog box. (See Figure 4.8.)
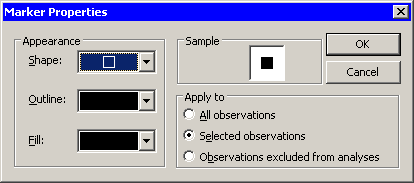
The Marker Properties dialog box contains the following UI controls:
- Shape
-
sets the marker shape for the observations.
- Outline
-
sets the marker outline color for the observations.
- Fill
-
sets the marker fill color for the observations.
- Sample
-
shows what the marker with the specified shape and colors looks like.
- Apply to
-
specifies the set of observations whose markers will change. By default, changes are applied to only the selected observations.