| Contour Plot Properties |
This section describes the property tabs that are associated with a contour plot. To access the rotating plot properties, right-click near the center of a plot, and select Plot Area Properties from the pop-up menu.
For a discussion of the Observations tab, see Chapter 6, Exploring Data in Two Dimensions. For a discussion of the remaining tabs, see Chapter 9, General Plot Properties.
Contours Tab
The Contours tab controls attributes of the contours. You can use this tab to remove contours, create contours, and change the color or line styles of contours. The Contours tab is shown in Figure 7.18.
The Contours tab has two subtabs: the Contour Styles subtab and the Levels subtab. The Contours tab contains the following UI controls:
- Contour Levels
displays each contour in the plot. The contours are labeled by values of the Z variable. You can select one or more items in the list to change their properties or to remove them from the list.- Remove selected levels
removes contours that are selected in the Contour Levels list.-
 (large left arrow)
applies the current set of properties to the contours selected in the Contour Levels list. You must click the large left arrow to transfer the contour attributes to the selected items in the Contour Levels list, or to create new contours.- Contour Styles
-
specifies the contour colors and line styles. These attributes are not applied until you click the large left arrow ( ). The Contour Styles subtab contains the following UI controls:
 - Color
specifies a single color for the selected contour levels.
- Blend
specifies a gradient color map for a range of contour levels.
- Style
specifies a line style for the selected contours.
- Width
specifies a line width for the selected contours.
- Levels
-
specifies the number and range of contour levels. These contours are created when you click the large left arrow (). The Levels subtab contains the following UI controls: - Number
specifies the number of contours to create.
- Minimum
specifies a value
 used in the creation of new contours.
 - Maximum
specifies a value
 used in the creation of new contours.
You can create a set of contours by using the Levels subtab, as shown in Figure 7.20. Let  be the value in the Number field, and let and be the values in the Minimum and Maximum fields. These values specify that the interval between contours is
  .
.
When you click the large left arrow (), contours are created for the levels 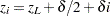 , for
, for  . This implies that the first level is
  and the last level is
  . No contours appear for the and levels because levels for extreme values are often degenerate. (For example, if
  on the domain
  , then the minimum value of
  is 0, and the contour for that level is a single point.)
If, instead, you know that you want the first contour to be at the level  and you want the contour interval to be
  , then it is straightforward to compute values of , , and that satisfy those conditions. You can choose
  and
and  , where is an integer.
If you want the contours to encompass all of your data, then you can compute 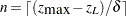 , where
  is the largest data value for the Z variable and
  is the least integer greater than
  . You should also choose so that
 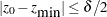 . For example, if the range of your data is
  , and you want a contour interval of
  with the first contour at
  , then you can choose
 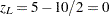 ,
, 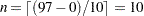 , and
, and  .
.
Contour Options Tab
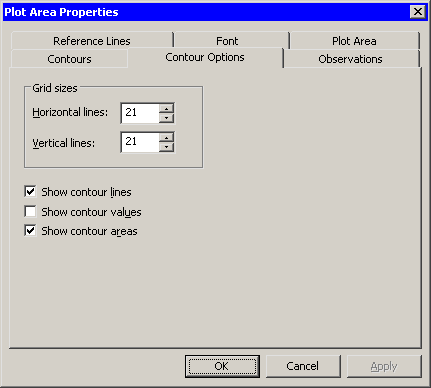
The Contour Options tab controls attributes of the contour plot. You can also use this tab to control the size of the grid used to construct contours. The Contour Options tab is shown in Figure 7.24. The Contour Options tab contains the following UI controls:
- Grid Sizes
specifies the resolution of the computational grid used to construct contours from the data. The algorithm that computes the surface uses a grid superimposed on the (X,Y) plane. This grid consists of evenly spaced subdivisions along the X and Y axes. Generally, having more subdivisions results in smoother contours, whereas having fewer subdivisions results in a rougher contours.- Show contour lines
specifies whether contours are shown.- Show contour values
specifies whether contour lines are labeled by the value of the Z axis variable.- Show contour areas
specifies whether the region between contours is filled with color.