| Plot Area Tab |
You can use the Plot Area tab (Figure 9.20) to set attributes of the plot area.
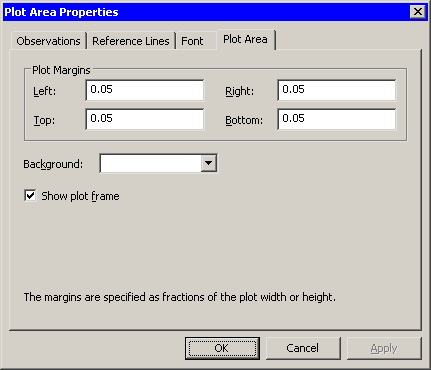
The Plot Area tab contains the following UI controls:
- Left
specifies the distance between the left edge of the plot area and the minimum value of the visible axis range for the X axis. The distance is specified as a fraction of the plot area’s width. The value must be in the range 0 to 0.8.- Right
specifies the distance between the right edge of the plot area and the maximum value of the visible axis range for the X axis. The distance is specified as a fraction of the plot area’s width. The value must be in the range 0 to 0.8.- Top
specifies the distance between the top edge of the plot area and the maximum value of the visible axis range for the Y axis. The distance is specified as a fraction of the plot area’s height. The value must be in the range 0 to 0.8.- Bottom
specifies the distance between the bottom edge of the plot area and the minimum value of the visible axis range for the Y axis. The distance is specified as a fraction of the plot area’s height. The value must be in the range 0 to 0.8.- Background
specifies the background color of the plot area.- Show plot frame
specifies whether the plot area’s frame is displayed.
Note:Because the plot area has margins, the edges of the plot area do not correspond to the minimum and maximum values of the axis. Let  and
and  be the minimum and maximum values of the horizontal axis. Let
  and
and  be the left and right margin fractions.
Define  . Then the left edge of the plot area is located at
  , and the right edge of the plot area is located at
  .
.
For example, if  ,
,  ,
,  , and
, and  , then
  . The left edge of the plot area is located at
  , while the right edge is located at
  .
.