| Box Plot Properties |
This section describes the Boxes tab that is associated with a box plot. To access the box plot properties, right-click near the center of a plot, and select Plot Area Properties from the pop-up menu.
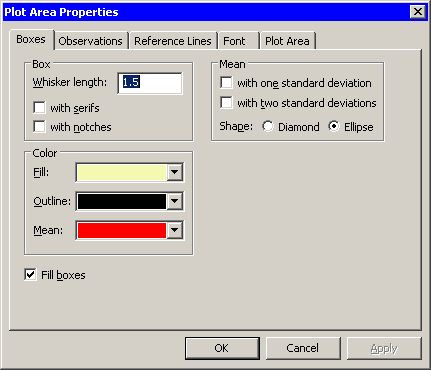
The Boxes tab controls attributes of the box plot. The Boxes tab is shown in Figure 5.18.
The Boxes tab contains the following UI controls:
- Box: Whisker length
sets the length of the whiskers. A length of means that whiskers are drawn from the quartiles to the farthest observation not more than times the interquartile distance (Q3–Q1).
 - Box: with serifs
specifies whether each whisker is capped with a horizontal line segment.- Box: with notches
specifies whether each box is drawn with notches. The medians of two box plots are significantly different at approximately the 0.05 level if the corresponding notches do not overlap.- Mean: with one standard deviation
specifies whether each box is drawn with mean markers that extend one standard deviation from the mean. The central line of the mean marker indicates the mean. The upper and lower extents of the mean marker indicate the mean plus or minus one standard deviation.- Mean: with two standard deviations
specifies whether each box is drawn with mean markers that extend two standard deviation from the mean.- Mean: Shape
specifies whether the mean markers are drawn as a diamond or an ellipse.- Color: Fill
sets the fill color for each box.- Color: Outline
sets the outline color for each box.- Color: Mean
sets the color for mean markers.- Fill boxes
specifies whether each box is filled with a color. When not selected, only the outline of the box is shown.
For a discussion of the Observations tab, see Chapter 6, Exploring Data in Two Dimensions. For a discussion of the remaining tabs, see Chapter 9, General Plot Properties.