| General Plot Properties |
| Graph Area Tab |
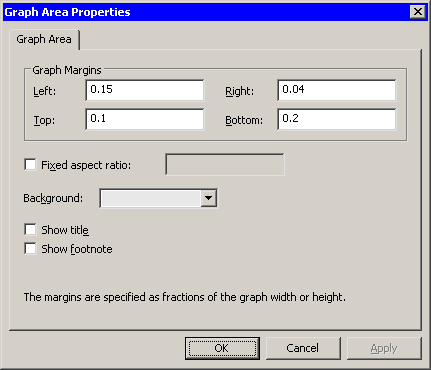
You can use the Graph Area tab (Figure 9.21) to set attributes of the graph area.

The Graph Area tab contains the following UI controls:
- Left
specifies the distance between the left edge of the graph and the left edge of the plot area. The distance is specified as a fraction of the graph’s width. The value must be in the range 0 to 1.- Right
specifies the distance between the right edge of the graph and the right edge of the plot area. The distance is specified as a fraction of the graph’s width. The value must be in the range 0 to 1.- Top
specifies the distance between the top edge of the graph and the top edge of the plot area. The distance is specified as a fraction of the graph’s height. The value must be in the range 0 to 1.- Bottom
specifies the distance between the bottom edge of the graph and the bottom edge of the plot area. The distance is specified as a fraction of the graph’s height. The value must be in the range 0 to 1.- Fixed aspect ratio
specifies a fixed ratio between units on the Y axis and units on the X axis. When you select this check box, you can specify the ratio. If a plot has a fixed aspect ratio, then the Graph Margins are not active.- Background
specifies the background color of the graph area.- Show title
- Show footnote
If you select Show title, the graph initially displays a default title. Click the title to edit it. You can also change the title’s font or position by right-clicking the title and selecting Properties from the pop-up menu. The section Annotation Properties describes the dialog box that appears.
A default footnote appears when you select Show footnote. To edit the footnote, follow the preceding instructions.
If you do not want to display a plot’s title or footnote, open the Graph Area Properties dialog box, and clear the appropriate check boxes on the Graph Area tab.
Copyright © SAS Institute, Inc. All Rights Reserved.