| General Plot Properties |
| Example: Label Observations |
In this example, you label observations in a scatter plot according to values of a third variable.
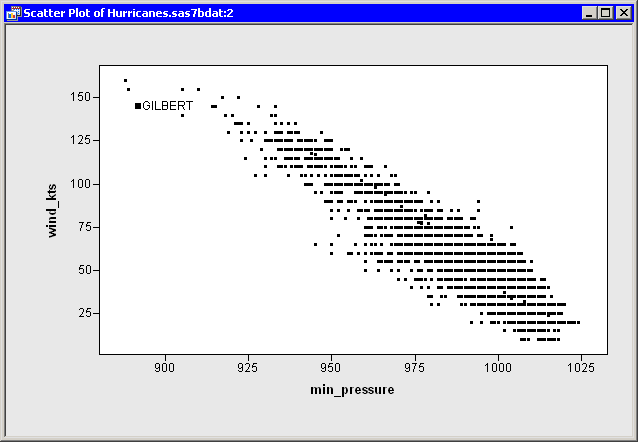
Open the Hurricanes data set and create a scatter plot of wind_kts versus min_pressure.
The scatter plot appears. (See Figure 9.14.)
Click an observation.
The selected observation is labeled by its position in the data table.

Right-click near the center of the plot, and select Plot Area Properties from the pop-up menu.
The Plot Area Properties dialog box appears. (See Figure 9.15.)
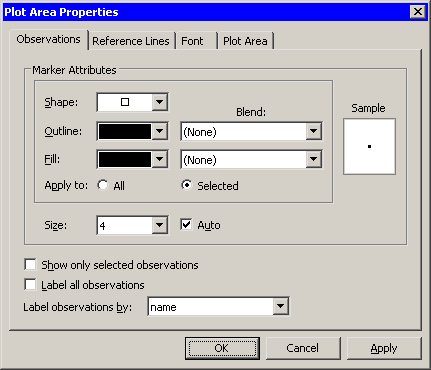
Select name from the Label observations by list.
Click OK.
The label for the selected observation updates, as shown in Figure 9.16. If you click subsequent observations, each label displays a storm name.
Note:When you select Label observations by in the Plot Area Properties dialog box, it affects only the scatter plot to which the dialog box belongs. If you create a second plot, that new plot defaults to using observation numbers to label observations.
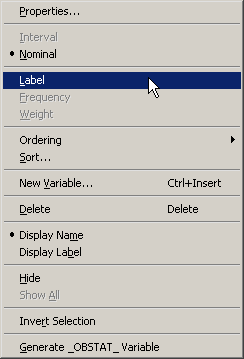
You can also set a default label variable that is used for all plots. In the data table, right-click a variable heading. Select Label from the pop-up menu, as shown in Figure 9.17. The values of the selected variable are displayed when you click observations in a plot (unless that plot overrides the default).
Copyright © SAS Institute, Inc. All Rights Reserved.