| Plotting Subsets of Data |
| Part 1: Create an Indicator Variable |
Using the DATA step is an easy way to create a variable that enumerates the observations for each cyclone. The following steps use the Variable Transformation wizard to create the indicator variable. See Custom Transformations for details about the Variable Transformation wizard.
If you have not already done so, open the Hurricanes data set.
Select Analysis  Variable Transformation from the main menu.
The Variable Transformation wizard appears, as shown in Figure 12.8.
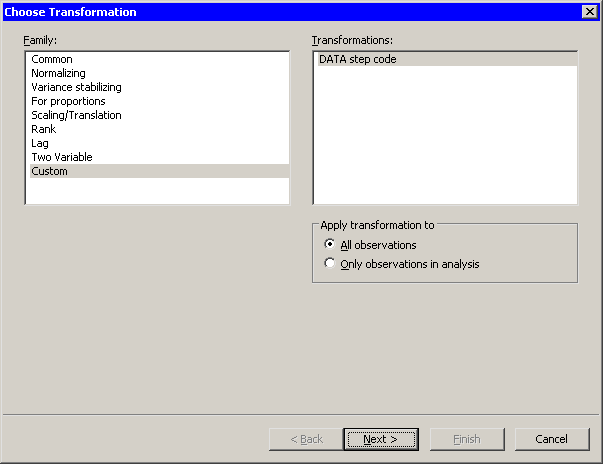
Select Custom from the Family list and click Next.
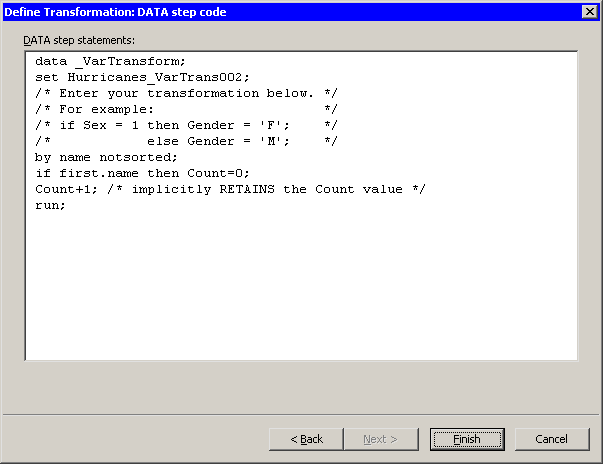
The second page of the wizard provides a window where you can enter DATA step statements.
Type in the following DATA step statements, prior to the RUN statement, as shown in Figure 12.9.
   by name notsorted;
   if first.name then Count=0;
   Count+1; /* implicitly RETAINS the Count value */
Click Finish.
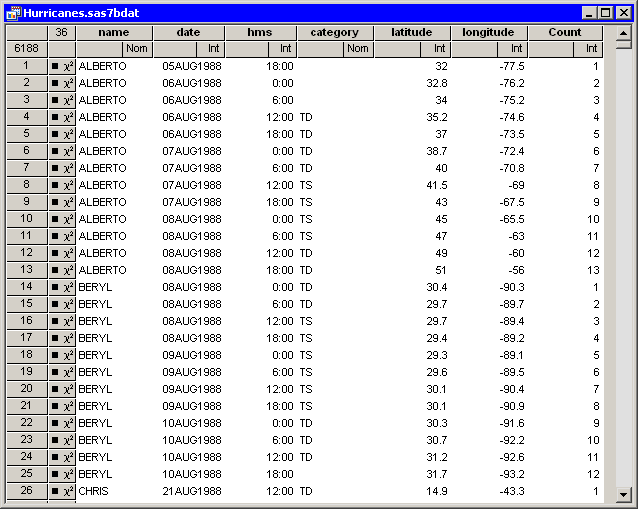
A new variable, Count, is added to the data table. The variable enumerates the observations for each cyclone. In particular, Count=1 indicates the first observation for each cyclone. Figure 12.10 shows the new variable. (Some variables in the table are hidden.)
Copyright © SAS Institute, Inc. All Rights Reserved.