| Axis Properties |
Changing an Axis Label
An axis label is text near an axis that identifies the axis variable. You can change the axis label. By default, plots display the name of a variable as the label. However, you might prefer that the plot display a variable’s label instead of its name. Or you might prefer to customize the axis label in some other way.
To change the axis label properties, right-click while the mouse pointer is on the axis label. You can then select Axis Label Properties from the pop-up menu. The Axis Label Properties dialog box appears, as shown in Figure 10.5.
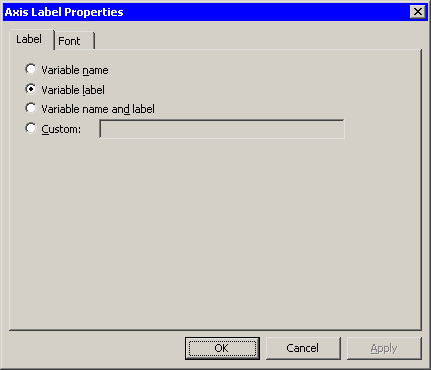
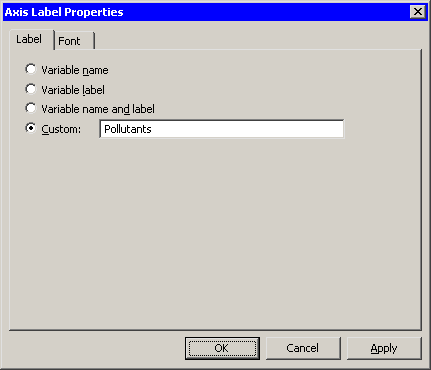
You can display a variable’s label instead of the variable’s name by selecting Variable label. If the variable does not have a label defined, or if you prefer to display a different label, you can select Custom and type your own label. This is shown in Figure 10.6.
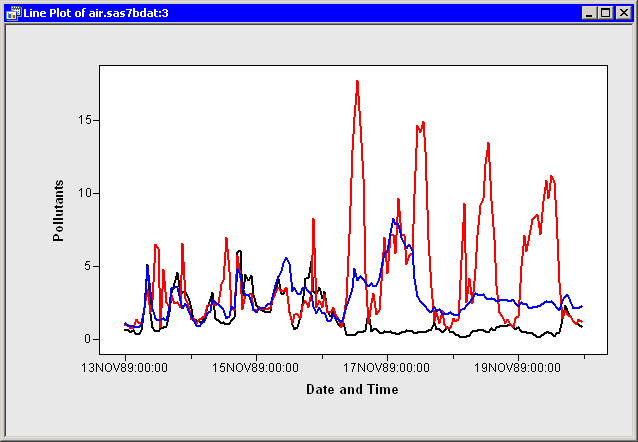
One instance in which you might want to define your own label is for a line plot that has multiple Y variables. If the Y variables all measure different aspects of a single quantity, you can replace the multiple Y labels with a single custom label. For example, Figure 10.7 shows a line plot of the co, o3, and so2 variables versus datetime for the Air data set. Each of the Y variables is a kind of pollutant, so the three Y labels are replaced with a single custom label.
Copyright © SAS Institute, Inc. All Rights Reserved.