| Axis Properties |
| Example: Change Positions of Axis Tick Marks |
To change the default tick marks for the axis of an interval variable:
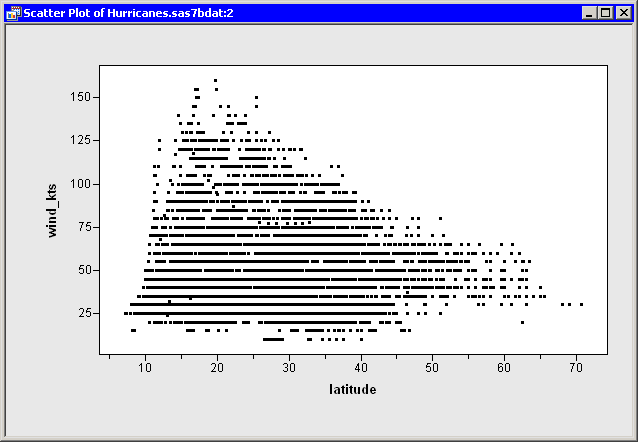
Open the Hurricanes data set, and create a scatter plot of wind_kts versus latitude.
The scatter plot appears. (See Figure 10.1.) Note that the latitude axis has only a few tick marks. You might decide to add a few additional tick marks.

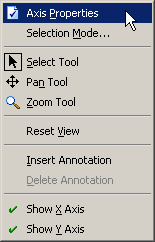
Right-click the horizontal axis of the plot, and select Axis Properties from the pop-up menu, as shown in Figure 10.2.
The Axis Properties dialog box appears, as shown in Figure 10.3. This is a quick way to determine the anchor location, tick unit, and tick range for an axis.
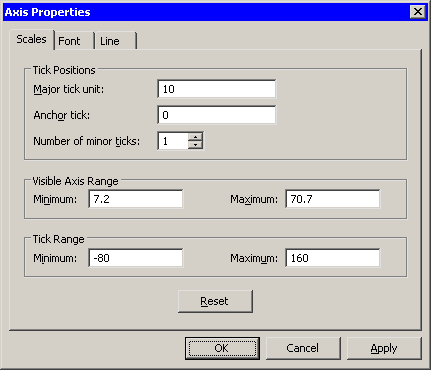
Change the Major tick unit value to 10.
Change the Anchor tick value to 0.
Change the Number of minor ticks value to 1.
Click OK.
The latitude axis updates, as shown in Figure 10.4.
Copyright © SAS Institute, Inc. All Rights Reserved.