| Exploring Data in One Dimension |
Box Plots
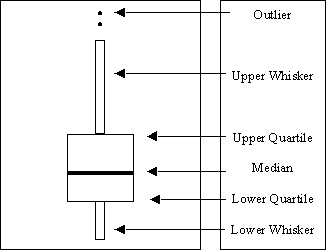
A box plot summarizes the distribution of data sampled from a continuous numeric variable. The central line in a box plot indicates the median of the data, while the edges of the box indicate the first and third quartiles (that is, the 25th and 75th percentiles). Extending from the box are whiskers that represent data that are a certain distance from the median. Beyond the whiskers are outliers: observations that are relatively far from the median. These features are shown in Figure 5.14.
This section describes how to use a box plot to visualize the distribution of a continuous (interval) variable. You can also use box plots to see how the distribution changes across levels of one or more nominal variables.
Copyright © SAS Institute, Inc. All Rights Reserved.