| Model Fitting: Generalized Linear Models |
| Explore the Data |
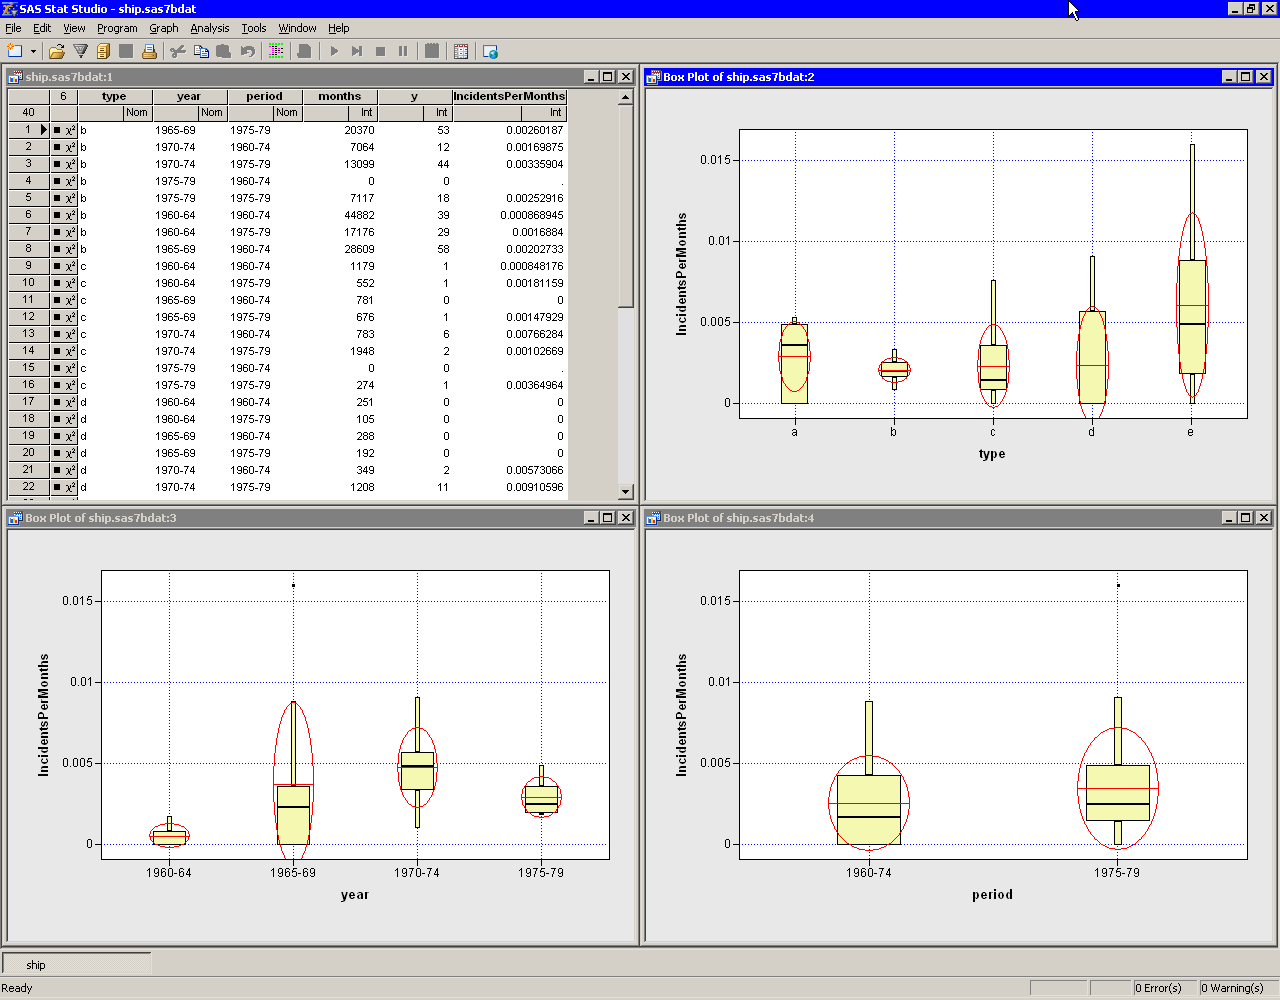
To use box plots to explore the data:
You can use box plots to explore how the ratio of Y to months varies according to the levels of the classification variables.
Figure 24.13 shows plots that indicate how the number of damage incidents per month varies with the explanatory variables. The Variable Transformation wizard is used to create a new variable, IncidentsPerMonth, as the ratio of Y and months. The new variable was created by using the Y / X transformation from the Two Variable family of transformations. The Variable Transformation wizard is described in further detail in Chapter 32, Variable Transformations.
The three box plots indicate that the mean of IncidentsPerMonth is as follows:
highest for ships of Type e, and low for the other types
highest for ships constructed in the years 1970–74, and lowest for ships constructed in the years 1960–64
highest for ships that operated in the 1975–79 period, and lowest for ships that operated in the 1960–74 period
This preliminary analysis indicates that the main effects of type, year, and period are important in predicting IncidentsPerMonth. The next section creates a generalized linear model with these effects.
Copyright © SAS Institute, Inc. All Rights Reserved.