| Exploring Data in Three Dimensions |
Rotating Plots of Selected Variables
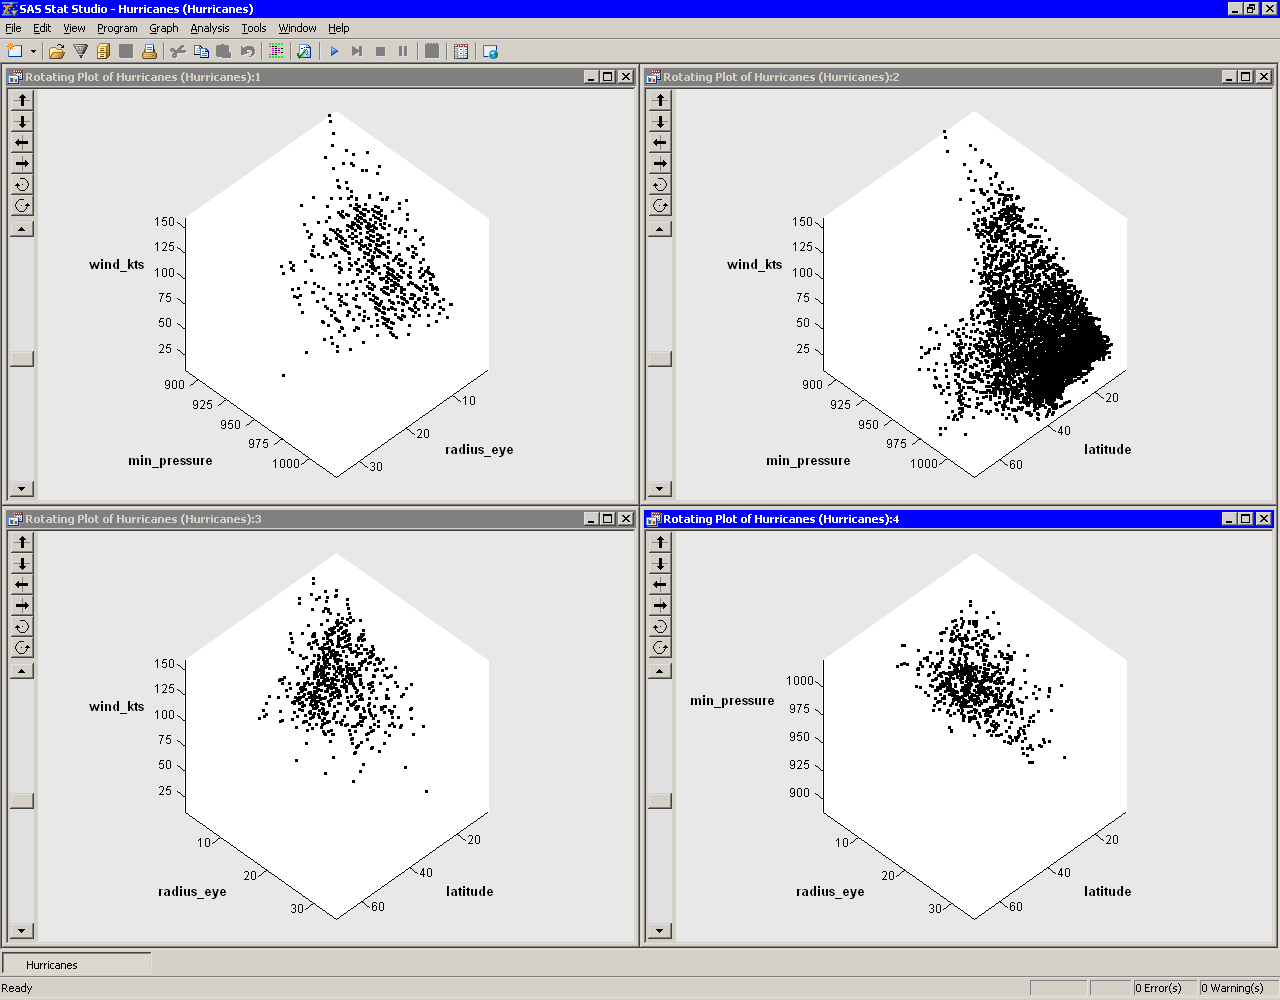
If one or more variables are selected in a data table when you select Graph ![]() Rotating Plot, then the rotating plot dialog box (Figure 7.2) does not appear. Instead rotating plots are created of the selected variables.
Rotating Plot, then the rotating plot dialog box (Figure 7.2) does not appear. Instead rotating plots are created of the selected variables.
All threefold combinations of the selected variables are plotted. That is, if you select ![]() variables, then you see a matrix of
variables, then you see a matrix of ![]() rotating plots.
rotating plots.
If you create a matrix of plots from selected variables, you can close the matrix by pressing the F11 key while any plot is active and selecting from the pop-up menu. Alternatively, you can use the Workspace Explorer (see the section "Workspace Explorer") to quickly close plots.
Variables with a Frequency or Weight role are ignored when you are creating rotating plots.
Figure 7.13 shows a matrix of rotating plots for four selected variables: wind_kts, min_pressure, radius_eye, and latitude.
 |
Figure 7.13: A Matrix of Rotating Plots
Copyright © 2009 by SAS Institute Inc., Cary, NC, USA. All rights reserved.